Group 1: Difference between revisions
(finished NonNewtonian Need to spell check) |
|||
| Line 76: | Line 76: | ||
[[File:ConvsAmp.png]] | [[File:ConvsAmp.png]] | ||
Early on we ran into an issue that there were a range of different values for the recipe and chemical properties of Non-Newtonian cornstarch mixture. Some researchers prefered to use Cornstarch with a oil while others simply used cornstarch and water. In fact, water mixed with cornstarch is a special Non-Newtonian called oobleck, coined by Dr. Suess. has an important role in teaching the physical chemstry for elementary school students. In order to figure out the ideal concintration we looked at how the upward onset of the Faraday instability bifurcation vs. concintration. As the figure above shows, the bifurcation asymptotically increases soon after a reciepe ratio of 2 parts cornstarch to 1 part water. For the rest of the experiment, we used a concintration of 2.5 : 1 since it seem to a fai upward bound. | Early on we ran into an issue that there were a range of different values for the recipe and chemical properties of Non-Newtonian cornstarch mixture. Some researchers prefered to use Cornstarch with a oil while others simply used cornstarch and water. In fact, water mixed with cornstarch is a special Non-Newtonian called oobleck, coined by Dr. Suess. has an important role in teaching the physical chemstry for elementary school students. In order to figure out the ideal concintration we looked at how the upward onset of the Faraday instability bifurcation vs. concintration. As the figure above shows, the bifurcation asymptotically increases soon after a reciepe ratio of 2 parts cornstarch to 1 part water. For the rest of the experiment, we used a concintration of 2.5 : 1 since it seem to a fai upward bound. | ||
== | =====Conclusion===== | ||
As the first video shows, we qualitatively observed holes and rising columns the unique pertibative properities. Above a critical acceleration, these holes remain persistant due to the thickening of the fluid. In fact the shearing pressure and strain of the pertibation causes water to dissolve out of the cornstarch solvent. As soon as the water is displaced, the free cornstarch molecules reform solid ionic bonds which then give the liquid it shear thickening properties.sd | As the first video shows, we qualitatively observed holes and rising columns the unique pertibative properities. Above a critical acceleration, these holes remain persistant due to the thickening of the fluid. In fact the shearing pressure and strain of the pertibation causes water to dissolve out of the cornstarch solvent. As soon as the water is displaced, the free cornstarch molecules reform solid ionic bonds which then give the liquid it shear thickening properties.sd | ||
Below is a video of the experiment we ran to measure the bifurcation for cornstarch. | Below is a video of the experiment we ran to measure the bifurcation for cornstarch. | ||
<videoflash>IVxmY0CDF5g</videoflash> | <videoflash>IVxmY0CDF5g</videoflash> | ||
In the video is abundantly clear that some cornstarch suspension is resists the driving amplitude and does not. In fact in some cases it seem like the solid-like layer of cornstarch was under the oscillating one. One theory for this inhomogenous boundary suggests that the inhomogenity is a result of the aging effects and packing of cornstarch as it is driven. Looking at the bifurcation diagrams we also see a jitter effect that causes an error in the parameter h/K that controls the vertical y(x=0) | In the video is abundantly clear that some cornstarch suspension is resists the driving amplitude and does not. In fact in some cases it seem like the solid-like layer of cornstarch was under the oscillating one. One theory for this inhomogenous boundary suggests that the inhomogenity is a result of the aging effects and packing of cornstarch as it is driven. Looking at the bifurcation diagrams we also see a jitter effect(*see N.J. Balmforth et al.) that causes an error in the parameter h/K that controls the vertical y(x=0) intial height of the bifurcation diagram. | ||
[[File:CS40.png]] | |||
===Newtonian vs. NonNewtonian=== | |||
==Other Captured Phenomena (Videos)=== | ==Other Captured Phenomena (Videos)=== | ||
===This Lab=== | ===This Lab=== | ||
Revision as of 03:03, 16 December 2011
Faraday Waves and Nonlinear Patterns
Group members: J. Orphee, P. Cardenas-Lizana, M. Lane, E. Grossman
Introduction
- Eponymously discovered by Faraday[1], Faraday Waves are standing waves on a fluid caused by vertical oscillatory motion. At given frequencies, these standing waves (vibrating at held the driving frequency) give surface patterns of n dimensional rotational symmetry; mainly square, hexagonal, and 8-fold quasi-static patterns. The wavelength of the standing waves are a function of viscosity, surface tension and density. Hence, understanding the relationship between these variables and the wavelength, will allow oscillation frequencies to be selected that produce standing waves of order n [2]:
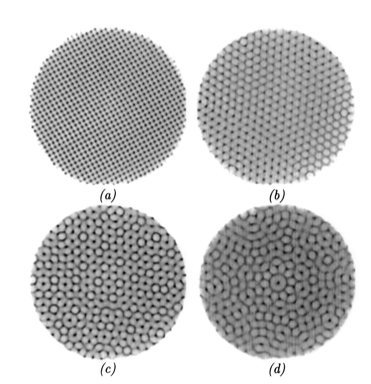

a) n=2 (square symmetry) b) n=3 (hexagonal symmetry) c) n=4 (8-fold quasiperiodic) d) n=5 (10-fold quasiperiodic)
Background Theory
Formula Pastebin
- <math>\nabla\cdot\mathbf{v} = 0</math>
- <math>
\frac{\partial \vec{v}}{\partial t}+\vec{v}\cdot\nabla\vec{v}= -\nabla \rho + \frac{1}{\mathrm{Re}} \nabla\cdot \left(\nabla\vec{v} + \nabla\vec{v}^T \right)+ \frac{1}{Fr}F(cos(2\pi t)-1)\mathbf{j}</math>
Previous Experiments
Binks and van de Water [2] choose to examine the stability of faraday waves as a function of excitation frequency. The wavelength of each mode can be determined from the inviscid deep fluid dispersion relation: ![]() where:
where:
![]() (g is acceleration due to gravity, k is the wave number, and 2w is the excitation frequency)
(g is acceleration due to gravity, k is the wave number, and 2w is the excitation frequency)
![]() (alpha is the surface tension, and rho is the density)
(alpha is the surface tension, and rho is the density)
Furthermore, the theory of this experiment is only valid for gamma << 1 where gamma is
![]() , the inverse Reynolds number.
, the inverse Reynolds number.
With these values, Binks and Water varied the amplitude of the oscillations for different frequencies and plotted the stable points on a phase diagram. In between each stable standing wave was a mixture of both waveforms. These transitionary states were shown to be bicritical points. Peilong and Vinals [4] were able to select stable points as a function of driving frequency and viscosity and plot them in a graph as shown:

Non-Newtonian Fluid Experiments
Non-Newtonian fluids have the property that its viscosity is not constant as stress is applied to it over time. As the phase diagram below shows the higher viscosity, this means that the critical amplitude and frequency required for Faraday waves is higher and up to a point the number of possible Faraday waves will decrease or stop all together above certain of frequencies and amplitude. It is even possible for holes to be created inside fluids such as cornstarch when undergoing vertical oscillation (Goldman [7]). Forming at a critical driving shaker acceleration and frequency, these holes are unusual in that their motion is not directly dependent on the Faraday waves, because the holes form far away from each other in the medium and tend to merge if they get to close to each other. In fact the radius R(t) of a hole is depends on acceleration a, frequency f, and the resonant frequency of the material f0 by the formula:
- <math>
\begin{aligned} R(t) & = K * F(t+\varphi ) \\ F(t) & = Driving Function \\ \tan (\varphi ) & = \frac{\alpha }{1-\frac{f^2}{f_0^2}}\\ \end{aligned} </math> Instead Dr. Goldman and other’s found that it was the stability of these holes to last and remain open is dependent on the magnitude of the maximum shear thickening gamma, which is in turn affected by the viscosity eta and other proprieties of the liquid in question. In general the formula for shear thickening is:
- <math>
\begin{aligned} \eta & =\frac{2 \tau}{\pi \gamma ^{n-1} R(t)^3} & For Non-Newtonian \\ \eta & =\frac{2 \tau}{\pi \gamma R(t)^3} & For Newtonian \end{aligned} </math>
Experimental Setup
This experiment is designed to reproduce the results of quantifying the observance of these waves by Binks and W. van de Water [2]. The expected results should also agree with Zhang and Vinals' [3] prediction of the amplitudes of the standing waves. The experiment will go a step further and not only test the theory out for different fluids (including a non-newtonian fluid), but for different oscillatory patterns (square, sinusoidal,and triangle) .
Parts List
- Circular Cylinder
- High Speed CCD Camera
- 2 fluids with different viscosities (oils)
- A non newtonian fluid (cornstarch)
- An electromagnetic exciter (or any device that can oscillate vertically)
Procedure

- Reproduce the experiments of Binks and Van de Water
- Fill a 440 mm diameter circular container with 20 mm height of experimental fluid
- Attach a 2 cm thick plate on the bottom of the container and a hollow conical structure attached to an electromagnetic exciter below that.
- Place piezo-electric accelerometers on the cone (one on bottom, two on top) to measure the acceleration cone. This allows control of the oscillation frequency.
- A high speed CCD camera is placed above the container to take snapshots of the standing waves. It is required that the frames per second of the snapshots are greater than the oscillation period of the standing waves.
- The amplitude of the oscillations are controlled by the electromagnetic exciter and increased in small steps (about 1%) where each wave is held for 2000 seconds first before taking 1000 s of images of the waves.
- Measurements of the amplitude of the waves are taken by a laser
- Compare the amplitudes and patterns with theory as a function of driving frequency
- Repeat experiment with another fluid, and a non newtonian fluid and checking if theory is consistent across different fluids.
- Observe the effects of changing the wave form on the standing waves
- Sinusoidal Waves
- Square Waves
- Triangle Waves
Visualization Of Faraday Waves
Results & Discussion
Newtonian fluid (water)
NonNewtonian Results
The intial plan for the Non-Newtonian part of our experiment was simply to measure and observe the similarities between the Non-Newtonian Faraday Waves and the Driving Signal Wave as well as observe the unique phenomena of holes and fingers that occur when on introduces a pertibation (see the video below). We decided to compare the bifurcation diagrams of Cornstarch to Water.
<videoflash>M_qXzyaIKI4</videoflash>
 Early on we ran into an issue that there were a range of different values for the recipe and chemical properties of Non-Newtonian cornstarch mixture. Some researchers prefered to use Cornstarch with a oil while others simply used cornstarch and water. In fact, water mixed with cornstarch is a special Non-Newtonian called oobleck, coined by Dr. Suess. has an important role in teaching the physical chemstry for elementary school students. In order to figure out the ideal concintration we looked at how the upward onset of the Faraday instability bifurcation vs. concintration. As the figure above shows, the bifurcation asymptotically increases soon after a reciepe ratio of 2 parts cornstarch to 1 part water. For the rest of the experiment, we used a concintration of 2.5 : 1 since it seem to a fai upward bound.
Conclusion
As the first video shows, we qualitatively observed holes and rising columns the unique pertibative properities. Above a critical acceleration, these holes remain persistant due to the thickening of the fluid. In fact the shearing pressure and strain of the pertibation causes water to dissolve out of the cornstarch solvent. As soon as the water is displaced, the free cornstarch molecules reform solid ionic bonds which then give the liquid it shear thickening properties.sd
Below is a video of the experiment we ran to measure the bifurcation for cornstarch.
<videoflash>IVxmY0CDF5g</videoflash>
In the video is abundantly clear that some cornstarch suspension is resists the driving amplitude and does not. In fact in some cases it seem like the solid-like layer of cornstarch was under the oscillating one. One theory for this inhomogenous boundary suggests that the inhomogenity is a result of the aging effects and packing of cornstarch as it is driven. Looking at the bifurcation diagrams we also see a jitter effect(*see N.J. Balmforth et al.) that causes an error in the parameter h/K that controls the vertical y(x=0) intial height of the bifurcation diagram.

Newtonian vs. NonNewtonian
Other Captured Phenomena (Videos)=
This Lab
Other Labs
Faraday Waves on Cornflour
Faraday Waves set to music
Group Members
- Juan Orphee
- Paul Cardenas-Lizana
- Michael Lane
- Elan Grossman
Sources
- [1] M. Faraday, Philos. Trans. R. Soc. London 121, 319 (1831)
- [2] D. Binks and W. van de Water, Phy. Rev. Lett. 78, 4043 (1997) <http://alexandria.tue.nl/openaccess/Metis132530.pdf>
- [3] W. Zhang and J. Viñals, Phys. Rev. E 53, R4286 (1996)
- [4] Peilong Chen and J. Vinals, Phys. Rev. Lett, 79, 2670 (1997) <http://homepages.spa.umn.edu/~vinals/mss/peilong1.pdf>
- [5] J. Bechhoefer and B. Johnson, Am. J. Phys, 64, 12 (1996). <http://arxiv.org/pdf/patt-sol/9605002v1>
- [6] A. Kudrolli and J.P. Gollub, Physica D 97, 133 (1996)
- [7] Florian S. Merkt, Robert D. Deegan, Daniel I. Goldman, Erin C. Rericha and Harry L. Swinney, PRL 92, 184501 (2004) <https://www.physics.gatech.edu/files/u347/public/prl84501.pdf>