Group 6: Difference between revisions
No edit summary |
No edit summary |
||
| Line 13: | Line 13: | ||
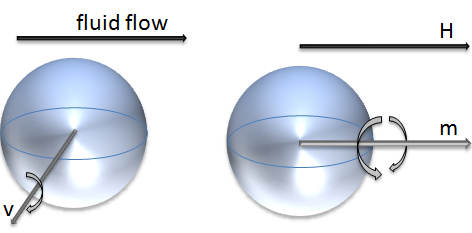
There are two known damping mechanisms unique to ferrofluids, rolling viscosity and magnetoviscocity. Rolling viscosity was first identified [12]. This mechanism takes into account the affect of beads rolling within the fluid as the name suggests. A ferrofluid, in the absence of a magnetic field, acts as any other colloid mixture; when there is fluid flow, shear within the fluid develops and beads begin to role as they are spun by the mechanical torque from the fluid shearing (vorticity of the fluid, v) (Figure 1, left). Under the influence of a magnetic field, however, magnetic particles are forced to align with the magnetic field. In other words, the magnetic moment of the bead, m, is parallel to the magnetic field, H (Figure 1, right). The rotation of the particle is now limited to spinning about its magnetic moment axis. Consider now the specific case in which the magnetic field is perpendicular to the vorticity; the particles will resist the rolling. This is analogous to dragging a car sideways; the wheels are locked on an axis that is perpendicular to the direction the wheels are trying to roll. | There are two known damping mechanisms unique to ferrofluids, rolling viscosity and magnetoviscocity. Rolling viscosity was first identified [12]. This mechanism takes into account the affect of beads rolling within the fluid as the name suggests. A ferrofluid, in the absence of a magnetic field, acts as any other colloid mixture; when there is fluid flow, shear within the fluid develops and beads begin to role as they are spun by the mechanical torque from the fluid shearing (vorticity of the fluid, v) (Figure 1, left). Under the influence of a magnetic field, however, magnetic particles are forced to align with the magnetic field. In other words, the magnetic moment of the bead, m, is parallel to the magnetic field, H (Figure 1, right). The rotation of the particle is now limited to spinning about its magnetic moment axis. Consider now the specific case in which the magnetic field is perpendicular to the vorticity; the particles will resist the rolling. This is analogous to dragging a car sideways; the wheels are locked on an axis that is perpendicular to the direction the wheels are trying to roll. | ||
[[File:Fig1.PNG| | [[File:Fig1.PNG|500px|thumb|center|Figure 1: Competing Forces Inducing Rolling Viscous Effect; Vorticity due to Shear Induced Mechanical Torsion (center), and Inhibition of Rolling due to Alignment of Magnetic Moment with Magnetic Field (right).]] | ||
Magnetoviscocity, on the other hand, takes in to account the time dependent process of pulling apart agglomerations and chains of larger particles (>10nm) [13]. Both mechanisms may act concurrently, yet the magnitude to which they affect the damping depends both on the particle size and concentration of that particle. | Magnetoviscocity, on the other hand, takes in to account the time dependent process of pulling apart agglomerations and chains of larger particles (>10nm) [13]. Both mechanisms may act concurrently, yet the magnitude to which they affect the damping depends both on the particle size and concentration of that particle. | ||
| Line 21: | Line 21: | ||
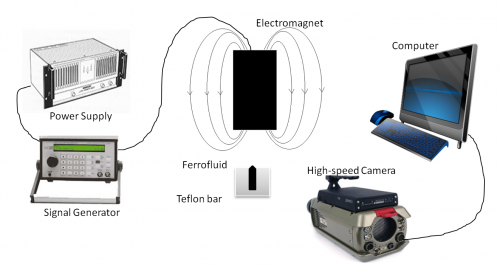
The experimental setup is shown in Figure 2. A 2.33mm diameter and 12 mm deep well was drilled into a Teflon bar. The diameter was chosen to be less than the critical wavelength, in order to assure a single peak would emerge. The critical wavelength being \({ \lambda }_{ C }=2\pi \sqrt { \sigma / \rho g } =8.3mm\) , where \(\rho =1.21\cdot { 10 }^{ 3 }\frac { ㎏ }{ { m }^{ 3 } }\) is the fluid density, \(\sigma =2.05\cdot { 10 }^{ -2 }\frac { ㎏ }{ { s }^{ 2 } }\) is the surface tension, and g is gravity. Stock EFH-1 ferrofluid was dispensed into the well using a syringe. The Bar was then placed into a sand filled bowl to allow for fine positioning relative to the electromagnet (unknown make and model). The electromagnet was centered directly over the ferrolfluid at an offset distance of ~7mm to allow for a ferrofluid peak of several mm to arise without being too close to the magnet such that fluid bridging occurs, or too far from the magnet such that the magnetic field strength is too low. | The experimental setup is shown in Figure 2. A 2.33mm diameter and 12 mm deep well was drilled into a Teflon bar. The diameter was chosen to be less than the critical wavelength, in order to assure a single peak would emerge. The critical wavelength being \({ \lambda }_{ C }=2\pi \sqrt { \sigma / \rho g } =8.3mm\) , where \(\rho =1.21\cdot { 10 }^{ 3 }\frac { ㎏ }{ { m }^{ 3 } }\) is the fluid density, \(\sigma =2.05\cdot { 10 }^{ -2 }\frac { ㎏ }{ { s }^{ 2 } }\) is the surface tension, and g is gravity. Stock EFH-1 ferrofluid was dispensed into the well using a syringe. The Bar was then placed into a sand filled bowl to allow for fine positioning relative to the electromagnet (unknown make and model). The electromagnet was centered directly over the ferrolfluid at an offset distance of ~7mm to allow for a ferrofluid peak of several mm to arise without being too close to the magnet such that fluid bridging occurs, or too far from the magnet such that the magnetic field strength is too low. | ||
[[File:Fig2.PNG| | [[File:Fig2.PNG|500px|thumb|center|Figure 2: Schematic of Experimental Setup]] | ||
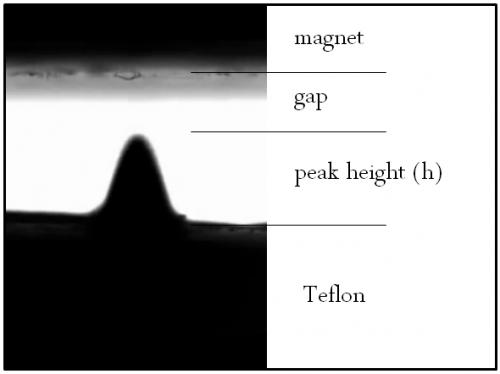
As a convention, the term peak height refers to the height of the tip of the bullet shaped profile of the fluid that arises under an electromagnetic field (Figure 3). | As a convention, the term peak height refers to the height of the tip of the bullet shaped profile of the fluid that arises under an electromagnetic field (Figure 3). | ||
[[File:Fig3.PNG| | [[File:Fig3.PNG|500px|thumb|center|Figure 3: Schematic of Ferrofluid Peak]] | ||
| Line 31: | Line 31: | ||
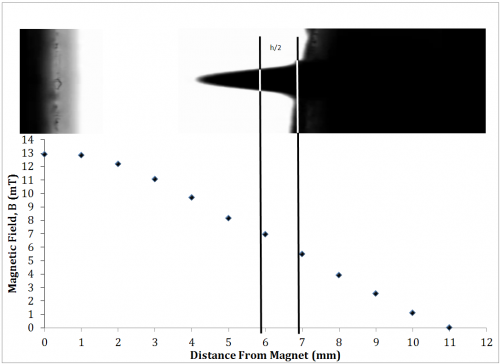
The spatial magnetic field profile was measured to determine the characteristic magnetic field acting on the ferrofluid. The magnetic field from the magnet was measured using a digital Teslameter (F.W. BELL 5070) and a micromanipulator (Tritech Research MINJ-1000). The magnetic field was measured for a 3 V bias to the magnet. The magnetic field was found to decay linearly as the distance from the magnet increased (Figure 4). A tip height of 2.5mm experiences a difference in magnetic field of 35% from base to tip. A rough approximation of the magnetic field is thus assumed to be uniform and acting at half peak height. The effective acting range may then be said to be between ~ 6-7mm. | The spatial magnetic field profile was measured to determine the characteristic magnetic field acting on the ferrofluid. The magnetic field from the magnet was measured using a digital Teslameter (F.W. BELL 5070) and a micromanipulator (Tritech Research MINJ-1000). The magnetic field was measured for a 3 V bias to the magnet. The magnetic field was found to decay linearly as the distance from the magnet increased (Figure 4). A tip height of 2.5mm experiences a difference in magnetic field of 35% from base to tip. A rough approximation of the magnetic field is thus assumed to be uniform and acting at half peak height. The effective acting range may then be said to be between ~ 6-7mm. | ||
[[File:Fig4.PNG| | [[File:Fig4.PNG|500px|thumb|center|Figure 4: Magnetic Field vs. Distance below Magnet at 3V bias]] | ||
| Line 38: | Line 38: | ||
[[File:Fig5.PNG| | [[File:Fig5.PNG|500px|thumb|center|Figure 5: Magnetic Field vs. Applied Bias at 6mm below Magnet]] | ||
| Line 58: | Line 58: | ||
Figure 7 shows the ferrofluid peak height as the magnetic field is increase. The field was stepped up (increasing H0) incrementally and then stepped back down (decreasing H0). The experiment produced a hyperbolic shaped curve with a noticeable hysteresis. | Figure 7 shows the ferrofluid peak height as the magnetic field is increase. The field was stepped up (increasing H0) incrementally and then stepped back down (decreasing H0). The experiment produced a hyperbolic shaped curve with a noticeable hysteresis. | ||
[[File:Fig7.PNG| | [[File:Fig7.PNG|500px|thumb|center|Figure 7: Ferrofluid Response to Unmodulated Field 7.58 mm Diameter Well]] | ||
The relatively sudden appearance of a peak is described as the Rosensweig (normal field) instability. This occurs at a critical magnetic field, Hc. A saddle node occurs as the field is decreased at a magnetic field of Hs. For this experiment | The relatively sudden appearance of a peak is described as the Rosensweig (normal field) instability. This occurs at a critical magnetic field, Hc. A saddle node occurs as the field is decreased at a magnetic field of Hs. For this experiment | ||
| Line 71: | Line 71: | ||
The model takes into account the cutoff condition in which \(\dot { h } =h=0\quad if\quad h<0\). | The model takes into account the cutoff condition in which \(\dot { h } =h=0\quad if\quad h<0\). | ||
[[File:Fig8.PNG| | [[File:Fig8.PNG|500px|thumb|center|Figure 8: Numerical Simulation]] | ||
==Elaboration of Classical Model by Dynamic Field Analysis== | ==Elaboration of Classical Model by Dynamic Field Analysis== | ||
| Line 82: | Line 82: | ||
Modulation of the frequency was conducted varying from 0.1Hz at irregular intervals up through 10Hz. Beyond 10Hz, the experimental setup failed, as the fluid would bridge the gap and adhere to the magnet. As the frequency was increased, the peak height would decrease significantly. It was thus necessary to increase the amplitude (Figure 9) to compensate. This was done systematically to bring the peak height to roughly the same height. Throughout the iterations, the peak height was brought to within 4.75% of the median peak height. The primary and secondary ordinate axis depict the amplitude and frequency, respectively, applied to maintain a max peak height of 148 pixels, and the ordinate represents the 6 separate trials. | Modulation of the frequency was conducted varying from 0.1Hz at irregular intervals up through 10Hz. Beyond 10Hz, the experimental setup failed, as the fluid would bridge the gap and adhere to the magnet. As the frequency was increased, the peak height would decrease significantly. It was thus necessary to increase the amplitude (Figure 9) to compensate. This was done systematically to bring the peak height to roughly the same height. Throughout the iterations, the peak height was brought to within 4.75% of the median peak height. The primary and secondary ordinate axis depict the amplitude and frequency, respectively, applied to maintain a max peak height of 148 pixels, and the ordinate represents the 6 separate trials. | ||
[[File:Fig9.PNG| | [[File:Fig9.PNG|500px|thumb|center|Figure 9: Modulation of Frequency and Necessary Amplitude to Maintain Peak Height]] | ||
| Line 92: | Line 92: | ||
The amplitude effect on the hysteresis is instantly evident. A representative comparison is given in Figure 10, in which in the hysteresis changes from monotonic to non-monotonic as the amplitude is increased from 3.6V to 5.2V. The figure represents the first half of the sinusoidal driving function. | The amplitude effect on the hysteresis is instantly evident. A representative comparison is given in Figure 10, in which in the hysteresis changes from monotonic to non-monotonic as the amplitude is increased from 3.6V to 5.2V. The figure represents the first half of the sinusoidal driving function. | ||
[[File:Fig10.PNG| | [[File:Fig10.PNG|500px|thumb|center|Figure 10: Ferrofluid Peak Response to a Single Period AC Signal]] | ||
Each of these two sets of data were then correlated to a numerical simulation (Simulink) derived from the presently discussed model. Figure 11 illustrates a qualitative agreement. | Each of these two sets of data were then correlated to a numerical simulation (Simulink) derived from the presently discussed model. Figure 11 illustrates a qualitative agreement. | ||
[[File:Fig11a.PNG| | [[File:Fig11a.PNG|500px|thumb|center]] | ||
[[File:Fig11b.PNG| | [[File:Fig11b.PNG|500px|thumb|center|Figure 11: Comparison of MATLAB Model to Ferrofluid Response to 3.6V (a) and 5.2V (b)]] | ||
| Line 108: | Line 108: | ||
Above 7Hz, the ability to capture the ferrofluid response became increasingly difficult as the fluid tended to jump to the magnet. In modulating the offset voltage, a driving frequency of 7Hz and driving amplitude of 3V were chosen as representative values, as the higher frequency was expected to elicit more interesting dynamical behavior, and the driving amplitude elicited a visible peak with sufficient gap space to grow. Also note, beyond a 0.5V offset voltage, the ferrofluid tended to jump. Figure 12 represents the ferrofluid response to increasing driving offset voltages. The offset sweep was from 0V up to 0.5V at 0.1V increments. Peak responses at 0.2V, 0.3V, 0.4V are characteristically identical as the 0.5V except in terms of peak height, and are thus not shown. | Above 7Hz, the ability to capture the ferrofluid response became increasingly difficult as the fluid tended to jump to the magnet. In modulating the offset voltage, a driving frequency of 7Hz and driving amplitude of 3V were chosen as representative values, as the higher frequency was expected to elicit more interesting dynamical behavior, and the driving amplitude elicited a visible peak with sufficient gap space to grow. Also note, beyond a 0.5V offset voltage, the ferrofluid tended to jump. Figure 12 represents the ferrofluid response to increasing driving offset voltages. The offset sweep was from 0V up to 0.5V at 0.1V increments. Peak responses at 0.2V, 0.3V, 0.4V are characteristically identical as the 0.5V except in terms of peak height, and are thus not shown. | ||
[[File:Fig12a.PNG| | [[File:Fig12a.PNG|500px|thumb|center]] | ||
[[File:Fig12b.PNG| | [[File:Fig12b.PNG|500px|thumb|center]] | ||
[[File:Fig12c.PNG| | [[File:Fig12c.PNG|500px|thumb|center|Figure 12: Changes in Ferrofluid Peak Response as Magnetic Field Offset is Increased. ]] | ||
| Line 117: | Line 117: | ||
The peak height is shown in Figure 13 for the offset sweep. Error bars indicate the sufficiently small deviation despite the aforementioned uncertainties. | The peak height is shown in Figure 13 for the offset sweep. Error bars indicate the sufficiently small deviation despite the aforementioned uncertainties. | ||
[[File:Fig13.PNG| | [[File:Fig13.PNG|500px|thumb|center|Figure 13: Peak Height as Offset is Increased]] | ||
| Line 123: | Line 123: | ||
The experimental bifurcation diagram of the driving offset parameter, shows a harmonic. | The experimental bifurcation diagram of the driving offset parameter, shows a harmonic. | ||
[[File:Fig14.PNG| | [[File:Fig14.PNG|500px|thumb|center|Figure 14: Period State]] | ||
| Line 133: | Line 133: | ||
The driving frequencies discussed herein must be compared to the characteristic time of the system. A decay time analysis was conducted by first holding the magnetic field and then removing the field and observing the time for the peak to drop in the absence of the field. The decay time was found to be 4.83 ms (Figure 15). | The driving frequencies discussed herein must be compared to the characteristic time of the system. A decay time analysis was conducted by first holding the magnetic field and then removing the field and observing the time for the peak to drop in the absence of the field. The decay time was found to be 4.83 ms (Figure 15). | ||
[[File:Fig15.PNG| | [[File:Fig15.PNG|500px|thumb|center|alt text]] | ||
Figure 15: Characteristic Time of the System (decay time) | Figure 15: Characteristic Time of the System (decay time) | ||
Revision as of 21:31, 16 December 2011
Nonlinear Dynamical Response of Ferrofluid to Magnetic Field
ABSTRACT
Ferrofluids exhibit an interesting and profound nonlinear dynamical behavior in response to both static and oscillating external magnetic fields. In the present paper, we begin by discussing recent works in the field of qualitatively describing the behavior of ferrofluids. We then proceed to examine a classical model used in several, more recent, studies, pointing out the critical kinematic parameters that may need incorporation into the model. An experiment was conducted to examine such a response and observe some of the interesting behaviors. The apparatus was configured such that a single peak was induced and observed with a high-speed camera. These experiments have shown the existence of both Rosensweig instability and viscous damping. Furthermore, experiments employing time dependent magnetic fields make a case for the significance of the gravitational and inertial forces on the ferrofluid.
INTRODUCTION
Ferrofluid is a colloidal fluid mixture of oil and ferromagnetic nanoparticles (~10nm) that react paramagnetically to a uniform magnetic field [1]. The fluid becomes magnetized in the presence of a magnetic field and un-magnetized when removed. The particles are coated with a layer of chemically absorbed surfactants to avoid agglomeration [2]. In deriving peaks, there are two important fluid properties: low viscosity and high magnetic permeability. Because these properties are inversely related, it is thus necessary to find a balance between the two. The fluid is known to exhibit an instability condition in which fluid peaks (bullet head like structures) spontaneously appear at the fluid-air interface. This is known as Rosensweig instability. Though ferrofluids are commonly used in mechanical, medical, aerospace, optical and other applications[1], the dynamic behavior of these fluids appears to be vastly under studied. Interaction between the fluid and a magnetic fields have elicited many interesting phenomena such as new or modified instabilities [3], field dependent viscosities [4], new dissipation mechanisms [5], and viscoelastic effects [6, 7]. Works have sought to describe the fluid response with models based on bifurcation characteristics [8], minimization of thermodynamic potential [6], and approximation by a half-ellipsoid [2]. In 1998, Rehberg et al. documented the nonlinear dynamics of a Ferrofluid–peak [8]. By temporal modulation of an electromagnetic field, Rosensweig instability was observed and fitted to a proposed model. Three characteristically different periods of the peak formation were identified. Rehberg later showed the restoring forces and damping coefficients of various surface waves are changed in response to a static magnetic field [9]. Engel et al. then analytically described both the static and dynamic surface profile [2, 10]. In 2004, Rannacher et al. discovered a double Rosensweig instability of a Ferrofluid film sandwiched between two immiscible nonmagnetic fluids. More recently, Oliveira et al examined the linear stability and nonlinear dynamics of a ferrofluid droplet within an external radial magnetic field [11]. Motivated by such an interesting array of effects we make a case for maturing the classical model by implementing a series of experiments in an attempt to isolate the effects of inertial and gravitational forces on the fluid.
Viscous Damping Effects of Ferrofluids
There are two known damping mechanisms unique to ferrofluids, rolling viscosity and magnetoviscocity. Rolling viscosity was first identified [12]. This mechanism takes into account the affect of beads rolling within the fluid as the name suggests. A ferrofluid, in the absence of a magnetic field, acts as any other colloid mixture; when there is fluid flow, shear within the fluid develops and beads begin to role as they are spun by the mechanical torque from the fluid shearing (vorticity of the fluid, v) (Figure 1, left). Under the influence of a magnetic field, however, magnetic particles are forced to align with the magnetic field. In other words, the magnetic moment of the bead, m, is parallel to the magnetic field, H (Figure 1, right). The rotation of the particle is now limited to spinning about its magnetic moment axis. Consider now the specific case in which the magnetic field is perpendicular to the vorticity; the particles will resist the rolling. This is analogous to dragging a car sideways; the wheels are locked on an axis that is perpendicular to the direction the wheels are trying to roll.
Magnetoviscocity, on the other hand, takes in to account the time dependent process of pulling apart agglomerations and chains of larger particles (>10nm) [13]. Both mechanisms may act concurrently, yet the magnitude to which they affect the damping depends both on the particle size and concentration of that particle.
Experimental Setup
The experimental setup is shown in Figure 2. A 2.33mm diameter and 12 mm deep well was drilled into a Teflon bar. The diameter was chosen to be less than the critical wavelength, in order to assure a single peak would emerge. The critical wavelength being \({ \lambda }_{ C }=2\pi \sqrt { \sigma / \rho g } =8.3mm\) , where \(\rho =1.21\cdot { 10 }^{ 3 }\frac { ㎏ }{ { m }^{ 3 } }\) is the fluid density, \(\sigma =2.05\cdot { 10 }^{ -2 }\frac { ㎏ }{ { s }^{ 2 } }\) is the surface tension, and g is gravity. Stock EFH-1 ferrofluid was dispensed into the well using a syringe. The Bar was then placed into a sand filled bowl to allow for fine positioning relative to the electromagnet (unknown make and model). The electromagnet was centered directly over the ferrolfluid at an offset distance of ~7mm to allow for a ferrofluid peak of several mm to arise without being too close to the magnet such that fluid bridging occurs, or too far from the magnet such that the magnetic field strength is too low.
As a convention, the term peak height refers to the height of the tip of the bullet shaped profile of the fluid that arises under an electromagnetic field (Figure 3).
The spatial magnetic field profile was measured to determine the characteristic magnetic field acting on the ferrofluid. The magnetic field from the magnet was measured using a digital Teslameter (F.W. BELL 5070) and a micromanipulator (Tritech Research MINJ-1000). The magnetic field was measured for a 3 V bias to the magnet. The magnetic field was found to decay linearly as the distance from the magnet increased (Figure 4). A tip height of 2.5mm experiences a difference in magnetic field of 35% from base to tip. A rough approximation of the magnetic field is thus assumed to be uniform and acting at half peak height. The effective acting range may then be said to be between ~ 6-7mm.
The magnetic field was then measured at ~7mm and found to increase linearly with increasing bias, as expected (Figure 5), and the resulting relationship to be H(V) = 3.44V-3.28.
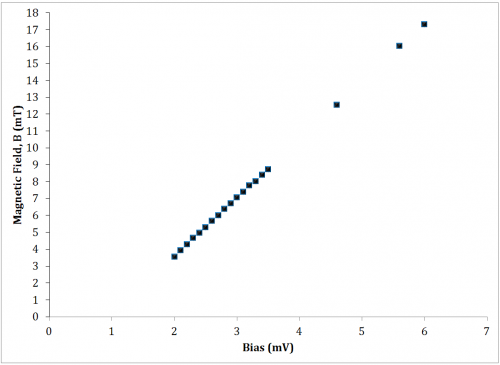
The electromagnet was driven by a power supply (Tecron 7550), modulated by a function generator (Telulex SG-100/A). The ferrofluid response was detected using a high speed camera (Phantom V210) with macro lens (Tamron SP 180mm) connected to a computer. Ferrofluid peak height was subsequently decoded into peak height (pixels) from the video recordings using MATLAB's built in mmreader() function.
METHODS AND RESULTS
The ferrofluid response was analyzed for both the static field case (DC, unmodulated) \(\epsilon (t)={ H }_{ 0 }\) and dynamic field case (AC, modulated) \(\epsilon (t)={ H }_{ 0 }+\Delta H\sin { (\omega t) }\)
Development of a Qualitative Model By Static Field Analysis
Figure 7 shows the ferrofluid peak height as the magnetic field is increase. The field was stepped up (increasing H0) incrementally and then stepped back down (decreasing H0). The experiment produced a hyperbolic shaped curve with a noticeable hysteresis.
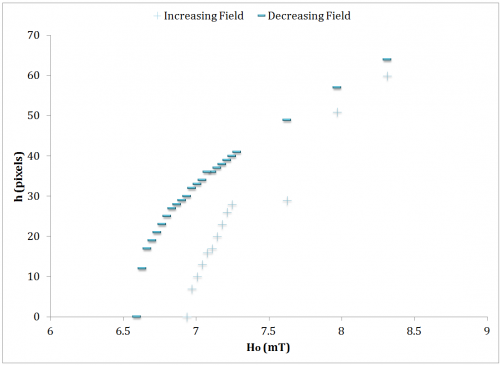
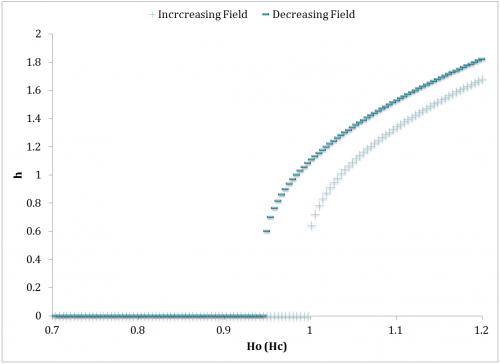
The relatively sudden appearance of a peak is described as the Rosensweig (normal field) instability. This occurs at a critical magnetic field, Hc. A saddle node occurs as the field is decreased at a magnetic field of Hs. For this experiment \({ H }_{ C }\quad \approx \quad 6.94mT\) and \( { H }_{ S }\quad \approx \quad 6.6mT\) Intuitively, the stable fixed point height relationship to the applied field is square root. This would imply an h2 term in the constitutive differential equation. A minimal theoretical model was presented by Rehberg et al. [1], herein referred to as the classical model. \(\ddot { h } +\beta \dot { h } =h-{ h }^{ 2 }+\epsilon (t)\) It can be seen from the system of first order differential equations \(\dot { h } =v,\quad \dot { v } =\beta v+h-{ h }^{ 2 }+\epsilon (t)\) that the fixed points are \( { v }^{ * }=0,\quad \quad { h }^{ * }=\cfrac { 1 }{ 2 } \pm \cfrac { 1 }{ 2 } \sqrt { 1+4\epsilon (t) } \) When \({ H }_{ 0 }={ H }_{ C }\), the solution \({ h }^{ * }=0\) becomes unstable. The saddle node occurs at \({ H }_{ S }={ H }_{ C }-\cfrac { 1 }{ 4}\) (Figure 8). The model takes into account the cutoff condition in which \(\dot { h } =h=0\quad if\quad h<0\).
Elaboration of Classical Model by Dynamic Field Analysis
In the dynamic field study, the magnetic field was modulated. The stability, likewise to the static field case, is determined by the Jacobian. The classification, however, depends on the modulated parameters and \(\beta\).
Existence of Viscous Damping Evidenced by Amplitude and Frequency Modulation
Modulation of the frequency was conducted varying from 0.1Hz at irregular intervals up through 10Hz. Beyond 10Hz, the experimental setup failed, as the fluid would bridge the gap and adhere to the magnet. As the frequency was increased, the peak height would decrease significantly. It was thus necessary to increase the amplitude (Figure 9) to compensate. This was done systematically to bring the peak height to roughly the same height. Throughout the iterations, the peak height was brought to within 4.75% of the median peak height. The primary and secondary ordinate axis depict the amplitude and frequency, respectively, applied to maintain a max peak height of 148 pixels, and the ordinate represents the 6 separate trials.
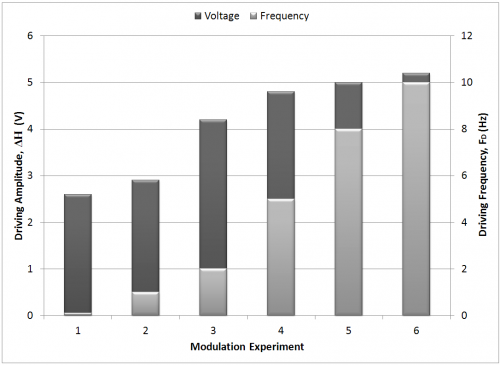
In an undamped system, the fluid peak height should reach a maximum height equal to that of the static case for an equivalent input magnitude. The necessity to compensate for increased driving frequency indicates effective viscous damping.
Necessity for Additional System Parameters in Classical Model Evidenced by Amplitude Modulation
The amplitude effect on the hysteresis is instantly evident. A representative comparison is given in Figure 10, in which in the hysteresis changes from monotonic to non-monotonic as the amplitude is increased from 3.6V to 5.2V. The figure represents the first half of the sinusoidal driving function.
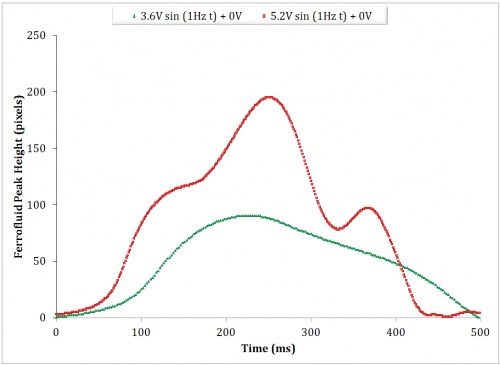
Each of these two sets of data were then correlated to a numerical simulation (Simulink) derived from the presently discussed model. Figure 11 illustrates a qualitative agreement.
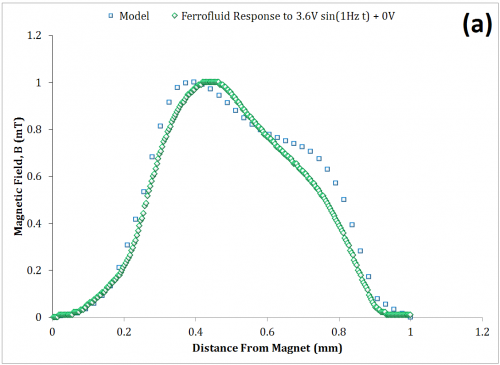
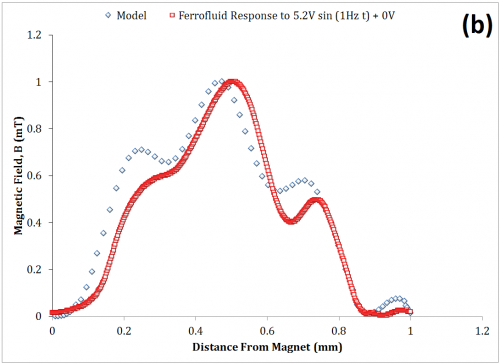
The model of the system has only a single system parameter, \(\beta\). Once a qualitative agreement is found by iterating the parameter \(\beta\), such as in Figure 11 (a), it is reasonable to say that merely increasing the amplitude, \(\Delta H\), within the numerical model should maintain a qualitative resemblance to the experimental data as the drive amplitude is increased. On the contrary, the qualitative resemblance of Figure 11 (b) was obtained by also iterating the other drive parameters such as offset and frequency. This indicates that the damping coefficient, alone, poorly describes the dynamic behavior of the system. While the viscous damping was shown to be significant in the previous section, additional parameters and are clearly needed.
Significance of Inertial Forces as Evidenced by Offset Modulation
Above 7Hz, the ability to capture the ferrofluid response became increasingly difficult as the fluid tended to jump to the magnet. In modulating the offset voltage, a driving frequency of 7Hz and driving amplitude of 3V were chosen as representative values, as the higher frequency was expected to elicit more interesting dynamical behavior, and the driving amplitude elicited a visible peak with sufficient gap space to grow. Also note, beyond a 0.5V offset voltage, the ferrofluid tended to jump. Figure 12 represents the ferrofluid response to increasing driving offset voltages. The offset sweep was from 0V up to 0.5V at 0.1V increments. Peak responses at 0.2V, 0.3V, 0.4V are characteristically identical as the 0.5V except in terms of peak height, and are thus not shown.
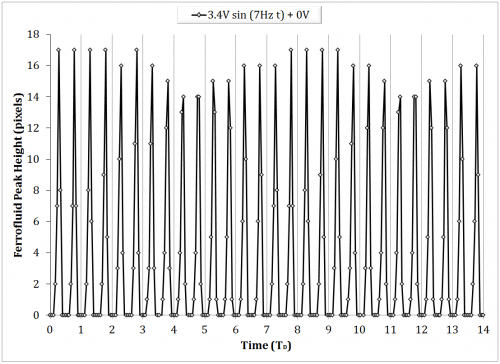
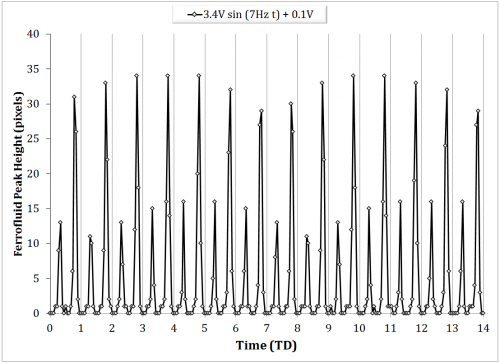
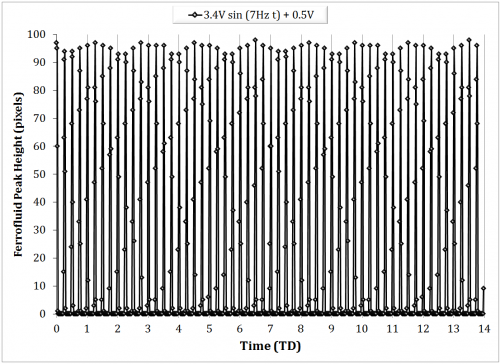
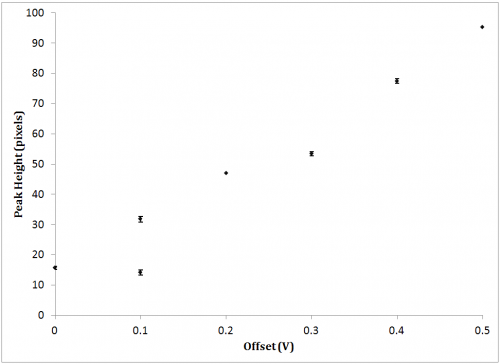
Within the figures, undulatory patterns can be seen at the max peak height. This likely because of one of two reasons. First, an artifact of the video decoding process, in which slight horizontal translations of the peak are detected. The non-uniformity of the magnetic field is expected to contribute to the secondary translation of the peak. Second, this could simply be due to sampling aliasing as a result of an insufficient frame rate. This explanation is supported by the fact that the 0V and 0.1V offset experiments have notably longer undulations, and they were taken at a frame rate of 125fps compared with 500fps for the others. The peak height is shown in Figure 13 for the offset sweep. Error bars indicate the sufficiently small deviation despite the aforementioned uncertainties.
The experimental bifurcation diagram of the driving offset parameter, shows a harmonic.
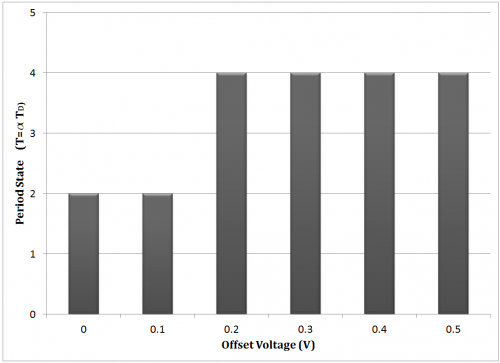
These two graphs, combined, illustrate that the fluid rises to a peak more frequently than the frequency the fluid is driven at, and in doing so, the peaks reach the nearly exact peak value. This sustains that the inertia of the fluid has equal to, if not greater relevance than, viscous damping in the high frequency domain, and is a point of interest in elaborating on the constitutive model.
Significance of Gravitational Forces as Evidenced by the Decay Time
The driving frequencies discussed herein must be compared to the characteristic time of the system. A decay time analysis was conducted by first holding the magnetic field and then removing the field and observing the time for the peak to drop in the absence of the field. The decay time was found to be 4.83 ms (Figure 15).
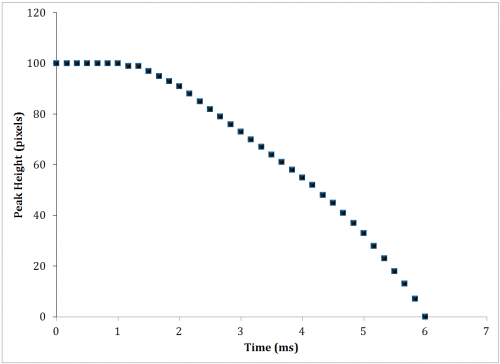
Figure 15: Characteristic Time of the System (decay time)
In comparison with the highest driving frequency within this study, fD = 10Hz, the downward portion of the period lasts exactly TD/4 = 1/(4fD) = 25ms. The time for the peak to decay naturally (decay time) is thus approximately 25% of the highest driving frequency implemented, 10Hz. Equivalently, the decay time is 0.2% of the slowest driving frequency implemented, 0.1Hz. It is reasoned that the gravitational effect on the hysteresis should be significant in the high frequency domain and insignificant in the low frequency domain, making it another point of interest in the efforts to elaborate on the constitutive model.
CONCLUSION
In the efforts to qualitatively describe the dynamics of ferrofluids, other works either utilize the classical model (through minimization of potential) or generalize the tip dynamics geometrically rather than kinematically. It is thus useful to develop the model further. These experiments have shown, first, the existence of the Rosensweig instability does occur for the experimental setup in which there is a nonuniform magnetic field. The static field analysis helped to identify a minimal model to describe the phenomena. In the dynamic case, modulation of both the amplitude and frequency to maintain a maximum peak height indicated both the existence of magnetically induced viscous damping as well as the relevance of the viscous damping term within the model. In a separate experiment, modulation of the amplitude only has shown that the viscous damping parameter cannot alone accurately describe the dynamics of the system. Furthermore, experiments showed high sensitivity to offset modulation. At a relatively high frequency of 7Hz, the system produces higher period states implying inertia plays a greater role and a possible point for improvement of the model. Future studies should make use of higher frame rates to reduce aliasing and uncertainty; should incorporate a countersink in the Teflon well to promote a flatter initial fluid surface; should utilize a more powerful magnet such that it may be set at a greater distance from the fluid, preventing fluid bridging and facilitating a wider range of driving parameters to be tested. It cannot be said conclusively that the gradient magnetic field played any role in the observations. Future studies making use of shallower wells with higher nonuniform magnetic fields may reveal further interesting behaviors and or relevant dynamics of the basic model.
REFERENCES
[1] R. E. Rosensweig, Ferrohydrodynamics: Cambridge University Press, 1985.
[2] A. Lange, et al., "Dynamics of a single peak of the Rosensweig instability in a magnetic fluid," Physica D, vol. 140, pp. 294-305, Jun 2000.
[3] W. Luo, et al., "Novel convective instabilities in a magnetic fluid," Physical review letters, vol. 82, pp. 4134-4137, 1999.
[4] J. P. McTague, "Magnetoviscosity of magnetic colloids," The Journal of Chemical Physics, vol. 51, p. 133, 1969.
[5] J. Liu, et al., "Field-induced structures in ferrofluid emulsions," Physical review letters, vol. 74, pp. 2828-2831, 1995.
[6] R. Friedrichs and A. Engel, "Statics and dynamics of a single ferrofluid-peak," The European Physical Journal B-Condensed Matter and Complex Systems, vol. 18, pp. 329-335, 2000.
[7] S. Odenbach, et al., "A rheometer dedicated for the investigation of viscoelastic effects in commercial magnetic fluids," Journal of Magnetism and Magnetic Materials, vol. 201, pp. 155-158, 1999.
[8] T. Mahr and I. Rehberg, "Nonlinear dynamics of a single ferrofluid-peak in an oscillating magnetic field," Physica D, vol. 111, pp. 335-346, Jan 1998.
[9] T. Mahr and I. Rehberg, "Magnetic Faraday instability," Europhysics Letters, vol. 43, pp. 23-28, Jul 1998.
[10] A. Engel, et al., "A single peak of the Rosensweig instability," Journal of Magnetism and Magnetic Materials, vol. 201, pp. 310-312, Jul 1999.
[11] R. M. Oliveira, et al., "Ferrofluid patterns in a radial magnetic field: Linear stability, nonlinear dynamics, and exact solutions," Physical Review E, vol. 77, Jan 2008.
[12] W. Hall and S. Busenberg, "Viscosity of magnetic suspensions," The Journal of Chemical Physics, vol. 51, p. 137, 1969.
[13] S. Odenbach and S. Thurm, "Magnetoviscous effects in ferrofluids," Ferrofluids, pp. 185-201, 2003.