Double pendulum
Double pendulum
Group members: Sang-Hyun Rah, Michael Clark, John Robinson, Jacob Blumoff
Main Presentation. Papers: John, Michael, Jacob
The double pendulum is a classic system in the study of chaos. We have explored the double pendulum experimentally, and compared results to a numerical simulation. This comparison was done in the time it takes for the second arm of the pendulum to ”flip,” based on initial starting conditions. We also performed analysis of the vertically driven case.

Overview
The double pendulum is a chaotic system as is expected [1, 2], since it is nonlinear and has a phase space of more than two dimensions. As such small differences in initial conditions grow exponentially [1]. Due to its simplicity and rich dynamical behavior, this system is widely used in introducing the concept of chaos [2]. Many introductory experiments use a driven double pendulum, as this permits longer periods of data gathering before damping of the system [2]. This driving typically takes the form of a motor driving the first joint of the pendulum in an oscillatory manner. An example of this is [3] which examined bifurcations leading to low-dimensional chaos using an apparatus of this nature.
Experiment

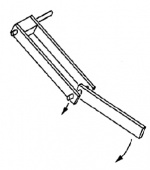
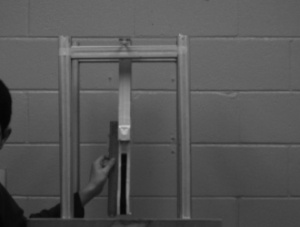
For our experiment, we used a double pendulum consisting of a rod supported by two others. The pendulum was connected to supports that could sinusoidally oscillate in the vertical direction at relatively low frequencies. We observed the motion of the pendulum at various initial positions, and noted whether it flips or not. If it did, the time it took was measured. The physical apparatus is shown at right.
The initial plan for tracking the pendulum was to measure the acceleration of the second arm using an Analog Devices ADXL321 accelerometer. This method was abandoned for two reasons. First, it was very difficult to extract actual angular measurements from the radial and tangential accelerations provided by the accelerometer. Second, and perhaps the more insurrmountable of the two, the data resolution provided by the accelerometer was insufficient to yield clear data, even after filtering.
The next method attempted was to track points (LEDs) on the pendulum using a high-speed camera. This method showed some promise, but was also discarded. The problem with this approach was that small search boxes in the point tracking program lost the LEDs when they crossed behind an obstructing support. Search boxes which were large enough to relocate the LEDs proved unstable, with too much of the search box going out of the frame of view.
The data acquisition method that was decided on was line-tracking using a high-speed camera. A piece of black tape was placed on the second arm of the pendulum for tracking. By opening the aperture of the camera to its maximum, the image got ”washed out” showing nothing but the black tape. Theoretically, by tracking the slope of the second arm and making a few a few measurements from reference images, one can extrapolate the angles of both arms at each time step. This processing was not done in real time however. Instead the video images were captured and saved for later processing. Below is a sample video of an experiment.
<videoflash>UBfS6mr2Ups</videoflash>
Simulation
Using MATLAB, we simulated the motion of the pendulum at various initial conditions. The theory we mainly referenced can be found here
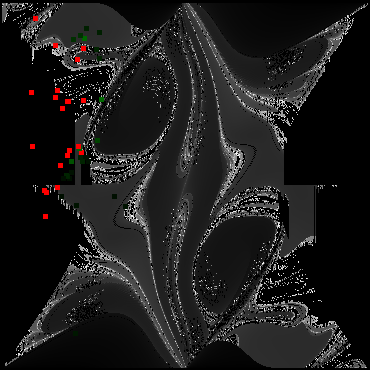
The green dots represent cases that, from our experiment, did flip. The red dots represent cases that did not. Note the good agreement of theory and experiment.
Results
Below is a figure of the simulation result which shows time to flip (dark: no flip; lighter: faster flip) on two-dimensional phase space. The first arm initial condition (horizontal axis) from - to -180 then from 180 to 0 degrees, and the second arm (vertical axis) from -180 to 180 degrees in approximately 1 degree steps. It is overlaid with experimental data points of time to flip, where red squares correspond to not flipping, and green indicates time to flip by intensity.

Our primary result is experimentally how long it took to flip based on intial conditions. That data is provided as an overlay on the computer-generated model. This matches many of the same general features as the model. Unfortunately we have far too few data points, and even the data we do have lacks the precision what we could generate numerically. Generally, however, we do see that the same areas flip or do not flip. With friction and damping losses in the physical experiment, edge and slow cases will switch from flipping to not flipping. There may indeed be usefulness in studying the double pendulum beyond simply an academic exercise. Dynamic stability could be an effective tool in engineering applications. Studying how situations can be made more stable by driving them, rather than damping them could be quite useful. Unfortunately our apparatus could not reach the necessary driving conditions to examine this driven stability. Exploring these bifurcations is the next step in studying the driven double pendulum. It would be good to study the timescale of return from perturbation and range of stability based on different driving frequencies, amplitudes, and mass distributions.
References
[1] Troy Shinbrot, Celso Grebogi, Jack Wisdom, and James A. Yorke, ”Chaos in a double pendulum,” Am. J. Phys., vol. 60, no. 6, pp. 491-499, June 1992.
[2] R. B. Levien and S. M. Tan, ”Double pendulum: An experiment in chaos,” Am. J. Phys., vol. 61, no. 11, pp. 1038-1044, November 1993.
[3] Peter Jäckel and Tom Mullin, ”A numerical and experimental study of codimension-2 points in a parametrically excited double pendulum,” Proc. R. Soc. Lond. A, vol. 454, pp. 3257-3274, 1998.