Group 4 2012: Difference between revisions
m (Protected "Group 4 2012" ([edit=sysop] (indefinite) [move=sysop] (indefinite))) |
|||
| (One intermediate revision by one other user not shown) | |||
| Line 104: | Line 104: | ||
to be the most difficult part of the setup. | to be the most difficult part of the setup. | ||
In the function a while loop ran through the lines of code. At the beginning it | In the function a while loop ran through the lines of code. At the beginning it | ||
Latest revision as of 21:52, 28 October 2014

Acoustic Synchrony
Introduction
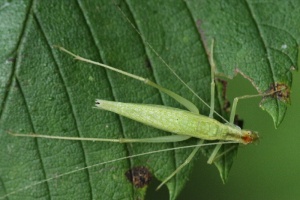
The reason that neighboring crickets tend to synchronize is because of their mating habits. A sexually responsive female cricket is attracted to the chirp rhythm and the male cricket who tends to chirp in the lead<ref>Greenfield, M. D., & Roizen, I. (1993). Katydid synchronous chorusing is an evolutionarily stable outcome of female choice. Nature, (364), 618-620.</ref>. Thus the male crickets will slow down there chirp rate to synchronize with a preceding chirper or speed up it's chirp rate to synchronize with a quickly imitating chirp. A quantitative analysis of this phenomina was carried out by Thomas J.\ Walker in 1969<ref name="walker69">Walker, T. J. (1969). Acoustic synchrony: two mechanisms in the snowy tree cricket. Science, (166), 891-894.</ref> He found that a cricket chirping at a constant rate, which consisted of him holding a tape player, resulted in the neighboring crickets to synchronize with his recorded chirp.
We used this model to test both the biological accuracy of Stogatz's integrate-and-fire equation and to create an experimental procedure of this system. The problem is that no one (at least what I could find) has tried to electronically simulate crickets, outside of a numerical simulation. So we attempted to analize Mirollo and Strogatzs' model for oscillators. The equation that Strogatz and Mirollo gave was a spin-off of Peskin's model for self-synchronization of the cardiac pace-maker.
\begin{equation} \label{eq:state} \frac{dx_i}{dt} = S_0 - \gamma x_i \end{equation} Where $x_i$ is the state of an oscillator with $x_i \in [0,1]$, $S_0$ is a property of the oscillator in units of \emph{Hz}, and $\gamma$ is a dissipative term which gives the phase curve a concave down shape. Strogatz and Mirollo declared that this is a necessary part for the integrate-and-fire model to synchronize. The criterion for synchrony is as follows,
\begin{equation} x_i = 1 \Rightarrow \; x_j(t^+) = \eta + x_j(t) \quad \forall j \neq i \end{equation} where $\eta$ is the associated coupling strength of the oscillator in question. This says that once one of the oscillators has fired the current state of \emph{all} the other oscillators are shifted by $\eta$, bringing the states closer together. Note: Peskin's model put the ``outside stimulus parameter inside the integrand<ref>C. E. Peskin. Mathematical Aspects of Heart Physiology. New York University, 1975.</ref>.
To follow Walker's model for synchrony we had to modify how this equation was implemented. Instead of global synchrony, we use a lead and follow model where the leader does not change it's chirp rate when the another cricket has chirped, but the follower will. To account for outside noise we added a time dependent noise term to the integrand. This is a common approach when dealing with oscillators<ref>P. Tass, M. G. Rosenblum, J. Weule, J. Kurths, A. Pikovsky, J. Volkmann, A. Schnitzler, and H.-J. Fre- und. Detection of n: m phase locking from noisy data: Application to magnetoencephalography. Physics Review Letters, 81:3291–3294, 1998. </ref>. Thus the resultant equation for our model is
\begin{equation} \label{eq:state2} \frac{dx_i}{dt} = S_0 - \gamma x_i + \zeta (t) \end{equation} \begin{equation} x_L = 1 \Rightarrow \; x_F(t^+) = \eta + x_F(t) \; \iff i=2 \end{equation} where $\zeta (t)$ is the external noise, $x_L$ is the state of the lead chirper, and $x_F$ is the state of the follower chirper.
Experimental Setup
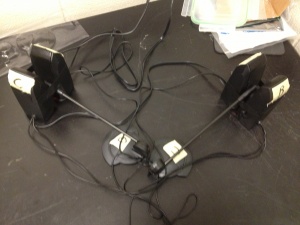
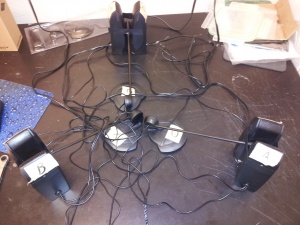
To simulate live crickets we procured three sets of speakers and three microphones. Each pair of speakers and microphone was to be one of our crickets. The speakers that we used were Logitech S120 2.0 Multimedia Speakers and the microphone was a inexpensive two dollar microphone whose brand name I cannot locate. In order to access multiple crickets simultaneously each microphone and speaker coupling was controlled by a StarTech.com 7.1 USB Audio Adapter External Sound Card. The latency for such a device is existent, but for our purposes and budget, this was the best option.
Once each sound card was plugged in and installed correctly we needed a way to control the input and output to each respective sound card and have a way to integrate the equation discussed above. This is where MATLAB 2011b came to the rescue. MATLAB has built-in functions that allow the user to designate the input and output to an object while also distinguishing between multiple sound cards. Using the object method of sound I/O in MATLAB, the function will not stop and wait until the sound card has finished executing the command (a new feature). This is optimal for our purposes because the state variable of each the respective cricket needs to be integrated constantly and it should be recording almost all of the time, which turned out to be the most difficult part of the setup.
In the function a while loop ran through the lines of code. At the beginning it would access the recorder object and tell it to start recording. In order to tell if the another cricket had chirped it would need to access the recorded sound (an array); if the max value was large enough it would then add $\eta$ to the current state.
The problem with this is that the loop reads the code so fast that it would skip integration if it was still recording; adding a long pause is out of the question as well because we desired real-time integration. Accounting for this took many hours of fine tuning, which in the end resulted with the function only recording in short time intervals and a short pause after the recorder object was called. The function must also integrate the state if the recorder object was still recording, as required by real-time analysis. A similar issue arose when the player object was called, this resulted in yet another pause. I believe this function could have been optimized, but time was short and we wanted some data.
Results
Before data collection began we needed a good set of parameter values that modeled a snowy tree cricket. This was done using different values of $\gamma$. $S_0$ is a characteristic parameter of an oscillator which, after solving Eq. \ref{eq:state} analytically, one can show is related to the period of an uncoupled oscillator.
\begin{equation} \tau = \gamma^{-1} ln \left (\frac{S_0}{S_0 - \gamma}\right ) \end{equation} So by plugging in the value of $\gamma$ and the known average chirp interval of a snowy tree cricket, which is 2 seconds, one will find that $S_0 \approx 0.5\, Hz$; for small dissipation values $S_0$ is approximately the natural frequency of the oscillator.
When we began to collect the data we wanted the chirp rate to be comparable to the natural frequency of a snowy tree cricket. When using the above $S_0$ of a system initially would not have worked because of the logic in the program that we had used. In order for the chirp rate to be 2 seconds apart the $S_0$ parameter was set to $\approx 12\,Hz$; each cricket having a slightly different $S_0$.
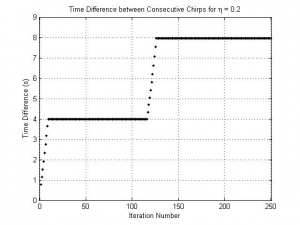
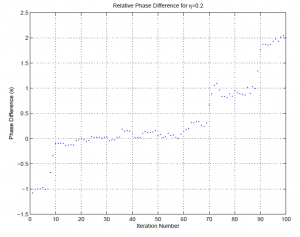
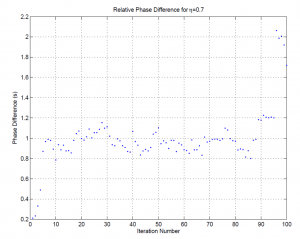
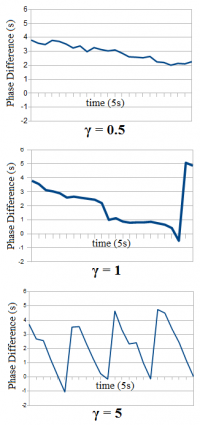
However, with $S_0 \approx\, 12 Hz$ I the found behavior to be inconsistent with a numerical simulation. The behavior of two crickets in a leader and follower system was found to shift in and out of phase by 180\degree with a coupling strength of 0.2. This plot shows the iteration number versus the time difference between consecutive chirps. So the crickets started 180\degree out of phase, then synchronized for more than half of duration of data collection, proceeded out of phase by 180\degree again (presumably perturbed out by the noise parameter), and finished in sync with each other. Note: The natural chirp interval was 2 seconds, thus the phase difference in intervals of two corresponds with synchrony. In a separate run with a $\eta = 0.7$ we that the two crickets stayed in a relatively constant phase lock 180\degree out of phase almost the entire time.
In the numerical simulation (with $\zeta (t) \sim 10^{-3}$) I found that they would go in and out of synchrony. However, instead of stopping for a short lived phase lock when 180\degree out of phase it would keep adding to their phase until they reached synchrony once again, and they would stay there until perturbed out of this state by $\zeta (t)$.
Discussion
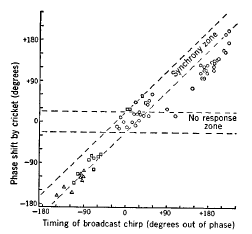
Our ultimate goal was to reproduce Walker's model. He found that the leader/follower method would synchronize for certain values of phase difference and the responding crickets phase shift. Due to complications with the experiment and limited time we were not able to reproduce these results. What we could have done is have the chirp not only increment by $\eta$, but also decrement. This would have been possible by running all of the I/O devices through a single MATLAB function simultaneously, instead of using separate MATLAB windows to operate each cricket individually.
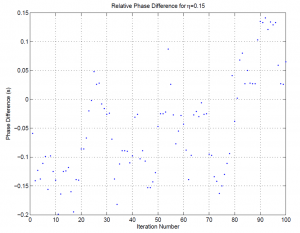
The most interesting outcome with the flawed model we used is that the crickets would still synchronize . The duration of synchrony did not last for long most of the time, but for certain values it stayed relatively in sync the entire duration of data collection. If you look carefully the plot has a very narrow axis with maximum values between -0.2 and 0.15 seconds. The human ear would not be able to distinguish between the beginning of one and the end of the other. This tendency was quite rare but still existent for certain values of $\eta$ and $S_0$. The implications of which show that our model is good but the application of it in the live simulation needs tweaked.
Our model also implies that the additive time dependent noise parameter affects the synchrony of the pulse-coupled oscillators but they will always come back to a state of synchrony with the follower cricket ahead of the lead crickets by a full chirp interval. Which is synchrony with phase differences of 2$\pi$. If time was not a factor, it would have been easy to show that decrements in $\eta$ could possibly keep them in a constant state of synchrony.
Investigation of Pseudo-Synchronization in Crickets
Background
Alternation and Synchronization
There are many known species of insects, where signal interactions between males of the species result in neighboring males entering collective phase relationships, such as synchronizing (phase angle ≈ 0°) or alternating (phase angle ≈ 180°). Signal interactions, in this instance, are defined as phase adjustments a male makes to its sexual advertisement call, in response to other males <ref name="greenfield1994synchronous">Greenfield, M. D. (1994). Synchronous and alternating choruses in insects and anurans: common mechanisms and diverse functions. American Zoologist,34(6), 605-615. </ref>. This phenomenon has been well studied in choruses of crickets <ref name="hartbauer2005mechanisms">Hartbauer, M., Krautzer, S., Steiner, K., & Römer, H. (2005). Mechanisms for synchrony and alternation in song interactions of the bushcricket mecopoda elongate (tettigoniidae: Orthoptera). J Comp Physiol A, (191), 175-188. </ref><ref name="jones1966acoustic">Jones, M. D. R. (1966). The acoustic behaviour of the bush cricket Pholidoptera griseoaptera I. Alternation, synchronism and rivalry between males. Journal of Experimental Biology, 45(1), 15-30. </ref><ref name="walker1969acoustic">Walker, T. J. (1969). Acoustic synchrony: two mechanisms in the snowy tree cricket. Science, (166), 891-894.</ref>, Katydid calls <ref>Greenfield, M. D., & Roizen, I. (1993). Katydid synchronous chorusing is an evolutionarily stable outcome of female choice. Nature, (364), 618-620.</ref>, and the flashing of fireflies <ref>Buck, J. (1988). Synchronous rhythmic flashing of fireflies. II. Quarterly Review of Biology, 265-289. </ref>.
The general behaviors of synchronization and alternation in insects has been attributed to the mating preferences of females of the species. Where antecedent studies have shown that, when in the presence of pairs of synchronizing males, females show preference to the male whose signal leads most often <ref name="greenfield1994synchronous" />. Other evolutionary explanations for these phenomenon include the preservation of species-specific temporal patterns <ref name="walker1969acoustic" />, and the concealment of calls as a response to acoustically orientated predators <ref>Otte, D. (1977). Communication in Orthoptera. How animals communicate, 334-361. </ref>.
The majority of mathematical models describing this type of behavior do so by viewing the insects as coupled biological oscillators, which follow a phase response curve <ref name="greenfield1994synchronous" /><ref name="mirollo1990synchronization">Mirollo, R. E., & Strogatz, S. H. (1990). Synchronization of pulse-coupled biological oscillators. 50(6), 1645-1662.</ref>. Males will compete for the lead position in the chorus by shifting their position on the phase response curve slightly, resulting in them firing sooner and chirping, and, if successful, taking the lead <ref name="mirollo1990synchronization" />.
The Peculiar Behavior of Pholidoptera griseoptera
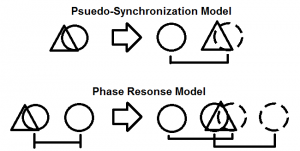
One species, which exhibits a very unique relationship arising from signal interactions, is Pholidoptera griseoptera, the dark bush cricket. When within proximity, males of this species will alternate their chirps, then synchronize for several iterations, before alternating once again <ref name="jones1966acoustic" />. The stage of synchrony observed is not perfect however; analysis of choruses has shown that there is always a partial overlap of the signals. In the case of two crickets, one will always be slightly leading the other in time <ref name="hartbauer2005mechanisms" />. This has been termed pseudo-synchronization (P-S), as audibly, it appears to be synchronization between the two crickets.

This complex behavior currently cannot be described according to models using a basic phase-response curve. The closest that a phase response model can come, is through phase drift, where a phase difference between two crickets signal rates would result in their signals gradually overlapping before moving apart again. However, there are two observations about the bush crickets behavior, which refute this as mere phase drift phenomena. First of all, as observed by Jones <ref name="jones1966acoustic" />, the shift from alternation to synchronization, between two crickets, is done in clearly discrete steps, not smoothly as would be expected if this was due to phase drift. Secondly, the amount of chirps for which the two crickets synchronize is highly variable, as opposed to the stable number we would expect from phase drift - over a 4 minute period, Jones was able to observe anywhere between 1 to 6 chirps per synchrony for the same two crickets <ref name="jones1966acoustic" />.
The data collected in Jones' research also brings forth another significant feature of the P-S behavior. Looking at two crickets of similar chirp rate, which have just undergone a synchrony event, it can be seen that the lead position always switches between crickets after such an event.
The Pseudo-Synchronization Model
The culmination of this information lends to the idea of a model in which crickets seem to carefully calculate their moves while attempting to overtake the lead position in the chorus. There are several inherent features of this type of model, which pose significant evolutionary advantages for a cricket. First of all, a cricket can more reliably gain the lead position in this model, as opposed to a basic phase response model, as it isn't sporadically shifting it's phase either up or down in the chance of taking the lead. It is making a calculated move into a P-S state, and then shifting forward into the lead. The second major advantage for a cricket following this type of model, is that when it does take the lead in this model, it will be by a maximum phase shift of roughly 180°. In the basic phase response model, there is a maximum phase shift which can be achieved if a cricket were to start from a position near P-S. However, in most cases, a cricket following a phase response model will not start from this ideal position, but in a range of unideal positions.
Methodology
Due to the fact that a mathematical model accurately describing the P-S behavior does not yet exist, data from live Pholidoptera griseoptera was analyzed in order to determine the favorability. In Jones' data of live cricket interactions, he notes the total duration of a recording,
the chirp rate of each cricket, the number of times a synchrony occurs, as well as the length of the synchrony (in chirps). Using this information, the synchrony occurrence ratio for live crickets was determined, and, under the assumption that all synchrony events do in fact lead to lead-switches, used as a measure of the favorability.
In order to be able to compare crickets controlled by a P-S model to crickets controlled by an alternative phase response model, specialized electronic crickets (SynCricks) were used. Each SynCrick consists of a microphone and a speaker, routed through a dedicated sound card, which is controlled through Matlab, where the particular phase-response model is defined. For the purpose of this study, the phase response model for coupled biological oscillators, as described by Mirollo and Strogatz <ref name="mirollo1990synchronization" />, was used. It must be noted, that due to instabilities within Matlab while analyzing a live audio feed, the base chirp rate of the SynCricks had to be slowed to 1 chirp per 5 seconds, as opposed to a more natural 0.5-1 chirps per second.
For the data collection, two SynCricks were arranged in a master-slave relationship; the master was preordained as the leader and made to chirp at a constant rate, whereas the slave started ≈ 180° out of phase with the master, and was allowed to regain the lead, following whichever model it employed. The start time of each SynCricks chirp was recorded to an excel spreadsheet for later analysis. As with the live crickets, data from the SynCricks was used to find the lead-switch occurrence ratio, used as a measure of favorability.
Results
From the more than 90 minutes of Jones' recordings of Pholidoptera griseoptera, 594 synchrony events were analyzed and used to determine the lead-switch occurrence ratio. These recordings occurred over several temperatures, and because crickets vary their chirp rate with temperature <ref name="walker1969acoustic" />, this was accounted for in all calculations. The syncrony occurrnce ratio, and thus lead-switch ratio, for Jones' cricket recordings was found to be 0.088.
The model employed by the SynCricks allowed for a variable parameter of the coupling constant, so a range of realistic values of this constant were sampled and used to determine an average lead-switch ratio (FIG. 3). As with the live crickets, this data was used to find the measure of favorability of the behavior controlling model, in the form of the lead-switch ratio. This value was found to be 0.042 for the Mirollo-Strogatz phase response model.
The value of the lead-switch ratio is time independent, and thus should not be affected by the time scaling of the SynCricks chirp rate, for comparison purposes. In addition, there was a recorded 7% error between trials in Matlab, possibly due to the same reasons that required the chirp rate scaling.
Discussion and Conclusion
A comparison of the lead-switch ratios of the live crickets and the SynCricks, immediately poses a significant finding. The live crickets, assumed to be following the P-S model, had nearly double the lead-switch events within a sample than the SynCricks following a phase response model. Even accounting for the 7% error between trials, this result is significant in supporting the evolutionary favorability of a P-S model. This type of model allows crickets to fastidiously gain the lead position in a chorus, which thus increases their chances of attracting females and propagating their progeny.
However, this result leaves much room for further study of the P-S model. Determining the relative favorability of other, more advanced models of biological oscillators, would be necessary, as this research only tested one of the simplest cases. Possible such models include the Kuramoto phase response model, as well as oscillator timed automata <ref>Bartocci, E., Corradini, F., Merelli, E., & Tesei, L. (2009). Model checking biological oscillators. Electronic Notes in Theoretical Computer Science, 229(1), 41-58.</ref>. Another point of interest would be obtaining the mathematical formulation of the P-S model, which would require the collection of more data from live bush crickets; both to increase Jones' original sample size, as well as to get chirp interactions at a higher time resolution than was available to Jones in 1966.