Group 1 2014: Difference between revisions
Chiral2014 (talk | contribs) No edit summary |
Chiral2014 (talk | contribs) No edit summary |
||
| (8 intermediate revisions by the same user not shown) | |||
| Line 7: | Line 7: | ||
* [[Media: Chiral_whitepaper.pdf | Whitepaper]] | * [[Media: Chiral_whitepaper.pdf | Whitepaper]] | ||
* [[Media: Chiral_presentation.pdf | Project presentation slides]] | * [[Media: Chiral_presentation.pdf | Project presentation slides]] | ||
* [[Media: | * [[Media: Separation-chiral-particles.pdf | Paper]] | ||
This is the website for the Chiral group. As a project for our Nonlinear Dynamics and Chaos class at Georgia Tech, we are investigating a method for the mechanical separation of chiral particles. The project is finished as far as this course concerns, but it will most likely result in more research and a more comprehensive paper. At the moment you can view our presentation material, whitepaper, actual paper, data, pictures and videos of our setup at this website. | This is the website for the Chiral group. As a project for our Nonlinear Dynamics and Chaos class at Georgia Tech, we are investigating a method for the mechanical separation of chiral particles. The project is finished as far as this course concerns, but it will most likely result in more research and a more comprehensive paper. At the moment you can view our presentation material, whitepaper, actual paper, data, pictures and videos of our setup at this website. | ||
| Line 20: | Line 20: | ||
== Theory == | == Theory == | ||
[[File:Shear.png | thumb | 300px | Figure 1: Force gradient viewed from above.]] | [[File:Shear.png | thumb | 300px | Figure 1: Force gradient viewed from above.]] | ||
We consider a sheer flow, <math>\mathbf{v}(x,y,z) = \dot{\gamma}y\hat{x}</math>. Here, <math>\mathbf{v}</math> is the fluid velocity, <math>\dot{\gamma}</math> is the shear rate, and <math>\hat{x}</math> is the direction of shear flow, in this case a unit vector in the <math>x</math> direction. <math>y</math> represents a linear gradient of force in the <math>\hat{y}</math> direction | We consider a sheer flow, <math>\mathbf{v}(x,y,z) = \dot{\gamma}y\hat{x}</math>. Here, <math>\mathbf{v}</math> is the fluid velocity, <math>\dot{\gamma}</math> is the shear rate, and <math>\hat{x}</math> is the direction of shear flow, in this case a unit vector in the <math>x</math> direction. <math>y</math> represents a linear gradient of force in the <math>\hat{y}</math> direction. We then consider a particle inserted into this flow: | ||
<math>\left<{\mathbf{V}(t)}\right> = \mathbf{v} + \dot{\gamma}\left<\tilde{\mathbf{g}}\mathbf{N}\right></math> | <math>\left<{\mathbf{V}(t)}\right> = \mathbf{v} + \dot{\gamma}\left<\tilde{\mathbf{g}}\mathbf{N}\right></math> | ||
| Line 29: | Line 29: | ||
<math>\left<V(z)\right> = \chi ga\dot{\gamma}</math> | <math>\left<V(z)\right> = \chi ga\dot{\gamma}</math> | ||
Where <math>\chi = \{ 0,-1,1 \}</math> indicates the direction of the particle's | Where <math>\chi = \{ 0,-1,1 \}</math> indicates the direction of the particle's chirality, <math>g</math> is a constant based on particle geometry, and a is the particle size. We see that this is simply a reduction of the second equation to one dimension. | ||
== Method == | == Method == | ||
| Line 36: | Line 36: | ||
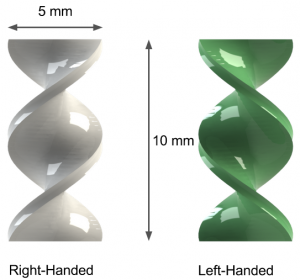
[[File:Particle.png | thumb | 300px | Figure 2: Model of the left hand chiral particle used in this experiment.]] | [[File:Particle.png | thumb | 300px | Figure 2: Model of the left hand chiral particle used in this experiment.]] | ||
A Taylor-Couette device was the centerpiece of our experiment. The device | A Taylor-Couette device was the centerpiece of our experiment. The device consisted of a bottom part, a top part, a transparent PVC tube and a rotating dowel. All parts except for the tube were printed on an ordinary 3-D printer (Makerbot Replicator). The distance between the outer tube and the inner dowel gives just enough clearance to let the particles align themselves freely. A larger distance (used in our first iteration) doesn't generate enough shear for the separation effect to be visible. The effect we are demonstrating has only been experimentally examined using rotating parallel plates before, this should be the first time the effect is demonstrated in Taylor-Couette flow. | ||
[[File:Chiral-Setup-Birdseye.jpg | thumb | 300px | Figure 3: Birds eye view of the experiment]] | [[File:Chiral-Setup-Birdseye.jpg | thumb | 300px | Figure 3: Birds eye view of the experiment]] | ||
The chiral particles are small helices described in Figure | The chiral particles are small helices described in Figure 2. Ten left handed particles, ten right handed particles and ten neutral particles (consisting of flat rectangles) were printed and used. | ||
The Taylor-Couette device was filled with transparent corn syrup, with a viscosity of 1450 - 2170 cSt was chosen. | The Taylor-Couette device was filled with transparent corn syrup, with a viscosity of 1450 - 2170 cSt was chosen. | ||
The rotation of the inner dowel was provided by an ordinary cordless drill, connected to a power supply unit. The velocity of the rotation was controlled by regulating the voltage of the drill. | The rotation of the inner dowel was provided by an ordinary cordless drill, connected to a power supply unit. The velocity of the rotation was controlled by regulating the voltage of the drill. | ||
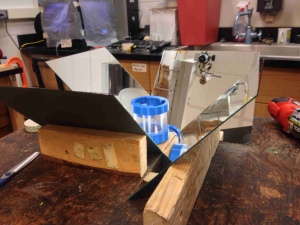
The data acquisition was all done by a single camera. In the first experiment the dowel was placed in between four tilted mirrors, and the camera was placed above the apparatus. This gave a full 360 degree view of the Taylor-Couette device | The data acquisition was all done by a single camera. In the first experiment the dowel was placed in between four tilted mirrors, and the camera was placed above the apparatus. This gave a full 360 degree view of the Taylor-Couette device. In the second and third experiments the camera was mounted facing the side of the Taylor-Couette device, and no mirrors were used. | ||
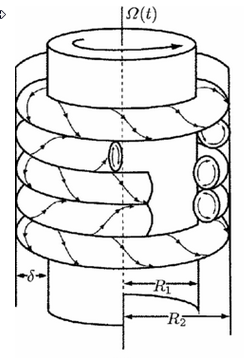
[[File:Tc.png | thumb | 300px | Figure 4: An illustration of Taylor | [[File:Tc.png | thumb | 300px | Figure 4: An illustration of Taylor vortices in a Taylor-Couette cylinder, courtesy of APS.org]] | ||
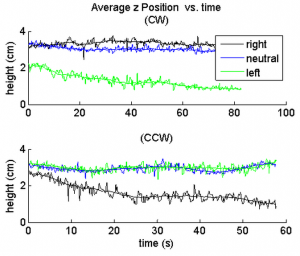
In the first experiment we put 30 particles in the device, evenly divided amongst left handed, right handed and neutral ones. The dowel was spun at 1.4 revolutions per second clockwise and then counter clockwise for about a minute. The position of all particles were recorded and tracked manually in MATLAB. Their mean <math>z</math> position was calculated and plotted. | In the first experiment we put 30 particles in the device, evenly divided amongst left handed, right handed and neutral ones. The dowel was spun at 1.4 revolutions per second clockwise and then counter clockwise for about a minute. The position of all particles were recorded and tracked manually in MATLAB. Their mean <math>z</math> position was calculated and plotted. | ||
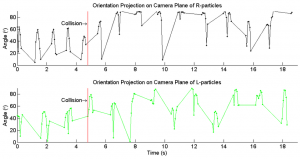
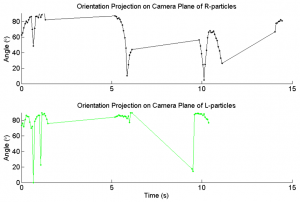
In the second experiment the Taylor-Couette device was loaded with one left handed particle and one right handed particle placed on opposite sides of the center dowel. They were aligned differently and spun at different speeds. The alignment angle of the particles were tracked manually in | In the second experiment the Taylor-Couette device was loaded with one left handed particle and one right handed particle placed on opposite sides of the center dowel. They were aligned differently and spun at different speeds. The alignment angle of the particles were tracked manually in Matlab and plotted as a function of time. | ||
In the third experiment the device was filled with different mixtures of corn syrup and kallieroscope fluid. The goal was to see weather we were experiencing vortices that could interfere with the alignment of the particles. | In the third experiment the device was filled with different mixtures of corn syrup and kallieroscope fluid. The goal was to see weather we were experiencing vortices that could interfere with the alignment of the particles. | ||
== Results and Conclusions == | == Results and Conclusions == | ||
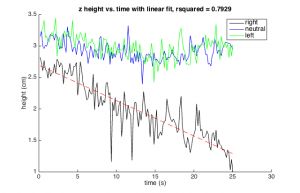
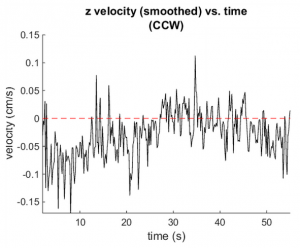
In Figure | In Figure 8 you can see data for the average $z$ position over time for each handedness. This clearly verifies the existence of the separation effect. During the data acquisition some particles reached the bottom of the device, creating a "knee" in the plot. Figure 9 shows the average velocity over time. We also took a linear fit to the data preceding the "knee", pictured in Figure 7. The fit has an <math>r^2</math> value of 0.79, indicating that the trend is indeed linear as expected. However, there is significant noise in the data. | ||
The alignment plots (Figures | The alignment plots (Figures 5, 6) need some explanation. Because no mirrors were used the particles come in and out of visual range, leading to gaps in the data. The reason we didn't collect data from all directions was that the Makino paper predicts that the particles should align, and that long-term effect should be seen even if only one side of the cylinder is observed. Also worth pointing out is a collision at t=5 in Figure 5. The collected data doesn't support the alignment effect predicted in Makino's paper. Even for longer durations of time no visible alignment was discovered. Banding wasn't observed at lower voltages, which indicates that Taylor vortices did not affect particle orientation. | ||
== Figures == | == Figures == | ||
{|style="margin: 0 auto;" | |||
| [[File:CW_angle.png | thumb | 300px | Figure 5: The alignment of one right handed and one left handed particle over time, 1.88 rev/s]] | |||
| [[File:Cw_angle2.png | thumb | 300px | Figure 6: The alignment of one right handed and one left handed particle over time, 0.578 rev/s]] | |||
|} | |||
{|style="margin: 0 auto;" | |||
| [[File: Linefit.png | thumb | 300px | Figure 7: Example of a linear function fit to the first data points, rsquare = 0.7929]] | |||
| [[File: Plot1.png | thumb | 300px | Figure 8: The average positions of ten particles of each handedness versus time. Data is shown for one clockwise (CW) and one counter-clockwise (CCW) experiment.]] | |||
| [[File: Plot2.png | thumb | 300px | Figure 9: lot of velocity versus time generated from the time derivitive of the couter-clockwise position vs. time data ]] | |||
|} | |||
<videoflash>20H0hCYn1e0</videoflash> | <videoflash>20H0hCYn1e0</videoflash> | ||
<videoflash>ucM8Mz2ncuE</videoflash> | <videoflash>ucM8Mz2ncuE</videoflash> | ||
<videoflash>jmCkyvK_RlQ</videoflash> | <videoflash>jmCkyvK_RlQ</videoflash> | ||
[[ | |||
[ | == References == | ||
[ | |||
[1] M. Makino and M. Doi, Migration of twisted ribbon-like particles in simple shear flow, Phys. Fluids 17, 103605 (2005). | |||
[2] M. Makino, L. Arai, and M. Doi, Shear Migration of Chiral Particle in Parallel-Disk, Jour. Phys. Soc. Japan 77(6), 064404 | |||
(2008). | |||
[3] M. Makino and M. Doi, ”Motion of micro-particles of complex shape,” Prog Polym Sci 30(8), 876 (2005). | |||
[4] V. Kantsler, J. Dunkel, M. Blaney, R. Goldstein, ”Rheotaxis facilitates upstream navigation of mammalian sperm cells,” | |||
eLife, 3:e02403 (2014) | |||
[5] A. Youd and C. Barenghi, ”Reversing and nonreversing modulated Taylor-Couette flow at finite aspect ratio,” Phys. Rev. | |||
72, 056321 (2005) | |||
[6] ”Viscosity Chart,” Available on http://www.research-equipment.com/viscosity\%20chart.html | |||
Latest revision as of 15:25, 12 December 2014
Sedimentation of Chiral Particles in a Shear Flow
Group members: Johannes Jansson, Brian McMahon, Christian Reitz and Will Savoie
This is the website for the Chiral group. As a project for our Nonlinear Dynamics and Chaos class at Georgia Tech, we are investigating a method for the mechanical separation of chiral particles. The project is finished as far as this course concerns, but it will most likely result in more research and a more comprehensive paper. At the moment you can view our presentation material, whitepaper, actual paper, data, pictures and videos of our setup at this website.
Abstract
This experiment examines the separation of chiral particles via shear flow. We placed 3-D printed chiral particles in a high viscosity fluid (Karo corn syrup) and used a Taylor-Couette apparatus to generate a shear flow. The results of this experiment support research by M. Makino and M. Doi and give us a degree of insight into naturally occurring chiral behavior.
Motivation
Sorting particles based on their characteristics is a common goal in industrial and commercial applications. In chemistry, small differences in molecules can change their impact on the macroscopic scale. One such physical difference is chirality. The behavior of chiral particles is interesting due to their prevalence in biology. Chirality can also be important in the development of drugs, as enantiomers often have differing chemical properties. Shear flow may provide a mechanical separation method whereas most current methods are chemical. Such a method would be of interest to pharmaceutical companies because a mechanical method can prove to be cheaper and easier to perform. Our experiment will grant us a greater understanding of the physics that would be involved in such separation.
Theory
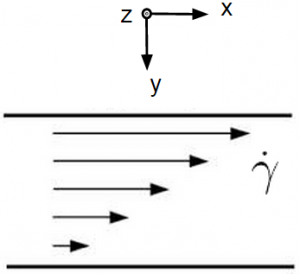
We consider a sheer flow, <math>\mathbf{v}(x,y,z) = \dot{\gamma}y\hat{x}</math>. Here, <math>\mathbf{v}</math> is the fluid velocity, <math>\dot{\gamma}</math> is the shear rate, and <math>\hat{x}</math> is the direction of shear flow, in this case a unit vector in the <math>x</math> direction. <math>y</math> represents a linear gradient of force in the <math>\hat{y}</math> direction. We then consider a particle inserted into this flow:
<math>\left<{\mathbf{V}(t)}\right> = \mathbf{v} + \dot{\gamma}\left<\tilde{\mathbf{g}}\mathbf{N}\right></math>
<math>\mathbf{V}(t)</math> is the velocity of the particle, <math>\tilde{\mathbf{g}}</math> is a tensor encompassing the geometry and size of the particle, and <math>\mathbf{N}</math> is the direction of shear as it applies to particle geometry. Summarily, the particle's velocity is a sum of flow advection (<math>\mathbf{v}</math>) and motion due to the particle's geometry in concert with applied shear. One may also include a term for brownian motion <math>\mathbf{V_b}</math>, but the size of our particles was sufficiently large to make this term negligible. Due to the force gradient in <math>\hat{y}</math>, an inserted object experiences a torque about its <math>\hat{z}</math> axis. This rotation created by this torque may, depending on the geometry of the object, lead to motion in the <math>\hat{z}</math> direction. We can write this motion as:
<math>\left<V(z)\right> = \chi ga\dot{\gamma}</math>
Where <math>\chi = \{ 0,-1,1 \}</math> indicates the direction of the particle's chirality, <math>g</math> is a constant based on particle geometry, and a is the particle size. We see that this is simply a reduction of the second equation to one dimension.
Method
To reach our goals for this experiment, we needed a highly viscous fluid in shear flow and, contained in the fluid, particles with of opposing chirality.
A Taylor-Couette device was the centerpiece of our experiment. The device consisted of a bottom part, a top part, a transparent PVC tube and a rotating dowel. All parts except for the tube were printed on an ordinary 3-D printer (Makerbot Replicator). The distance between the outer tube and the inner dowel gives just enough clearance to let the particles align themselves freely. A larger distance (used in our first iteration) doesn't generate enough shear for the separation effect to be visible. The effect we are demonstrating has only been experimentally examined using rotating parallel plates before, this should be the first time the effect is demonstrated in Taylor-Couette flow.
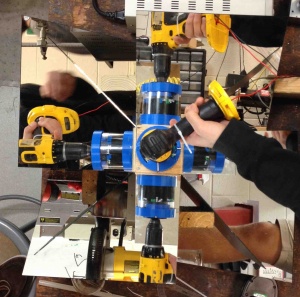
The chiral particles are small helices described in Figure 2. Ten left handed particles, ten right handed particles and ten neutral particles (consisting of flat rectangles) were printed and used. The Taylor-Couette device was filled with transparent corn syrup, with a viscosity of 1450 - 2170 cSt was chosen. The rotation of the inner dowel was provided by an ordinary cordless drill, connected to a power supply unit. The velocity of the rotation was controlled by regulating the voltage of the drill. The data acquisition was all done by a single camera. In the first experiment the dowel was placed in between four tilted mirrors, and the camera was placed above the apparatus. This gave a full 360 degree view of the Taylor-Couette device. In the second and third experiments the camera was mounted facing the side of the Taylor-Couette device, and no mirrors were used.
In the first experiment we put 30 particles in the device, evenly divided amongst left handed, right handed and neutral ones. The dowel was spun at 1.4 revolutions per second clockwise and then counter clockwise for about a minute. The position of all particles were recorded and tracked manually in MATLAB. Their mean <math>z</math> position was calculated and plotted. In the second experiment the Taylor-Couette device was loaded with one left handed particle and one right handed particle placed on opposite sides of the center dowel. They were aligned differently and spun at different speeds. The alignment angle of the particles were tracked manually in Matlab and plotted as a function of time. In the third experiment the device was filled with different mixtures of corn syrup and kallieroscope fluid. The goal was to see weather we were experiencing vortices that could interfere with the alignment of the particles.
Results and Conclusions
In Figure 8 you can see data for the average $z$ position over time for each handedness. This clearly verifies the existence of the separation effect. During the data acquisition some particles reached the bottom of the device, creating a "knee" in the plot. Figure 9 shows the average velocity over time. We also took a linear fit to the data preceding the "knee", pictured in Figure 7. The fit has an <math>r^2</math> value of 0.79, indicating that the trend is indeed linear as expected. However, there is significant noise in the data.
The alignment plots (Figures 5, 6) need some explanation. Because no mirrors were used the particles come in and out of visual range, leading to gaps in the data. The reason we didn't collect data from all directions was that the Makino paper predicts that the particles should align, and that long-term effect should be seen even if only one side of the cylinder is observed. Also worth pointing out is a collision at t=5 in Figure 5. The collected data doesn't support the alignment effect predicted in Makino's paper. Even for longer durations of time no visible alignment was discovered. Banding wasn't observed at lower voltages, which indicates that Taylor vortices did not affect particle orientation.
Figures
 |
 |
<videoflash>20H0hCYn1e0</videoflash> <videoflash>ucM8Mz2ncuE</videoflash> <videoflash>jmCkyvK_RlQ</videoflash>
References
[1] M. Makino and M. Doi, Migration of twisted ribbon-like particles in simple shear flow, Phys. Fluids 17, 103605 (2005).
[2] M. Makino, L. Arai, and M. Doi, Shear Migration of Chiral Particle in Parallel-Disk, Jour. Phys. Soc. Japan 77(6), 064404 (2008).
[3] M. Makino and M. Doi, ”Motion of micro-particles of complex shape,” Prog Polym Sci 30(8), 876 (2005).
[4] V. Kantsler, J. Dunkel, M. Blaney, R. Goldstein, ”Rheotaxis facilitates upstream navigation of mammalian sperm cells,” eLife, 3:e02403 (2014)
[5] A. Youd and C. Barenghi, ”Reversing and nonreversing modulated Taylor-Couette flow at finite aspect ratio,” Phys. Rev. 72, 056321 (2005)
[6] ”Viscosity Chart,” Available on http://www.research-equipment.com/viscosity\%20chart.html
