Group 3 2012: Difference between revisions
Group1-2012 (talk | contribs) |
Group1-2012 (talk | contribs) |
||
| Line 130: | Line 130: | ||
<div class="center" style="width:auto; margin-left:auto; margin-right:auto;"> | <div class="center" style="width:auto; margin-left:auto; margin-right:auto;"> | ||
{| | {| | ||
| [[File:map_screw.png|400px|thumb|center|Figure | | [[File:map_screw.png|400px|thumb|center|Figure 14: Iterative map for screw attractor]] | ||
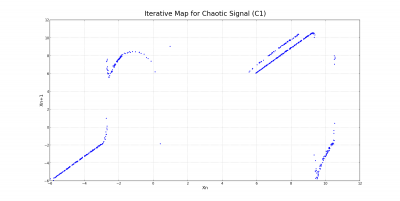
| [[File:map_c1.png|400px|thumb|center|Figure | | [[File:map_c1.png|400px|thumb|center|Figure 15: Iterative map for chaotic behavior across capacitor C1]] | ||
| [[File:map_c2.png|400px|thumb|center|Figure | | [[File:map_c2.png|400px|thumb|center|Figure 16: Iterative map for chaotic behavior across capacitor C2]] | ||
|} | |} | ||
</div> | </div> | ||
Revision as of 02:54, 14 December 2012
Chaos Circuits
Patrick Chang, Edward Coyle, John Parker, Majid Sodagar
The nonlinear dynamics of Chua’s circuit and its applications to communications is studied. Chaos is realized, and is investigated by calculating the Lyapunov exponent for the system. A three dimensional phase portrait for the characteristic “double scroll” is reconstructed from the two dimensional image, from which the correlation dimension is calculated. This experiment was done by designing Chua’s circuit in the laboratory and comparing results to a simulation.
Introduction
Chaos is aperiodic long-term behavior in a deterministic system that exhibits sensitive dependence on initial conditions [7]. There are many applications for chaotic systems, such as predicting nonlinear flow in the atmosphere, understanding the dynamics in cardiac arrhythmias, and handwritten character recognition. Certain studies show that a chaotic system made of circuits can produce novel musical sounds. However, in this experiment, we focus more on the applications of a chaotic system in communication. Chaotic signals are usually broad-band, noise like, and difficult to predict [8]. Therefore, chaotic systems are suitable for carrying information. In digital communication, sinusoidal carriers are used because they have optimal bandwidth efficiency and it is easier to reconstruct the original signal. However, their high power spectral density causes a high level of interference and enhances the probability of interception by other receivers [9]. Chaotic carriers can solve this problem. A chaotic transmitter can send the desired information masked by chaotic signals. This masked signal is then transmitted to the destination, and the signal might be intercepted on the way, but would not be decoded without the masking chaotic signal. At the destination, another chaotic signal generator will be synchronized with the chaotic signal generator at the transmitter and thus produce the exact replica of the masking chaotic signal. The masked signal will then be demodulated by subtracting the masking signal from it to reveal the desired information hidden within [10]. Also, broadband information carriers enhance the robustness of communication and are less vulnerable to interference from narrow-band disturbance. This is the basis of spread-spectrum communication techniques, such as the code division multiple access (CDMA) protocol used in the Global Positioning System (GPS) and in the third generation of mobile telephones.
In order to achieve masking information in chaotic signals to obtain secure communication, the chaotic oscillators, transmitter and receiver, must be synchronized. Initially, we wanted to achieve synchronization between two or more Chua's circuits acoustically [11] for the following reasons. Chua's circuit, introduced to the world by Leon Chua in 1983, is the simplest autonomous circuit that can exhibit a bifurcation and generate chaos, because it satisfies the three criteria for displaying chaotic behavior: containing one or more nonlinear components, one or more locally active resistor, and three or more energy-storage devices. It has been a very suitable subject for studying dynamical chaos by means of both laboratory experiments and computer simulations [6]. Acoustic coupling enables us to adjust various parameters to achieve synchronization, e.g. wave amplitude, feedback time delay, characteristic of media between the oscillators, etc.
However, after setting up our circuits and the acoustic component, we found out that the parts we had are too weak to communicate with the other circuit. Instead, in the process of building up the Chua’s circuits and adjusting their parameters to find chaotic signal, we found some interesting nonlinear behavior of the Chua’s circuit. So we decided to focus on characterizing the nonlinear dynamics of the Chua’s circuit. People have been characterizing Chua’s circuits by computer simulation, so we want to do it from an experimental point of view.
Design and Parts
Chua's Circuit
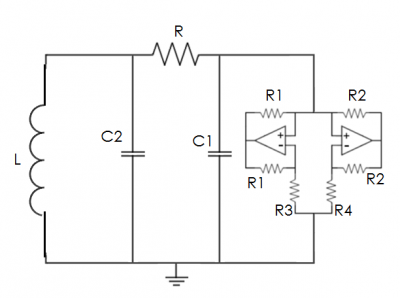
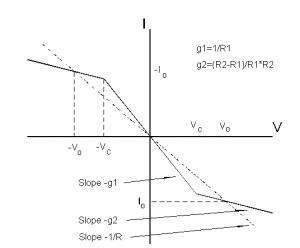
Chua’s circuit can be built several different ways. This experiment replicated the circuit diagram in Figure (1). It has four major components: (1) a variable resistor, whose resistance acts as the control variable, (2) two capacitors, whose electrical responses act as the dependent variables, (3) an inductor, and (4) Chua’s diode, which is the source of the nonlinearity in the system. The electrical response of Chua’s diode is shown in Figure (3) and corresponds to the function g(V) in the differential equations.
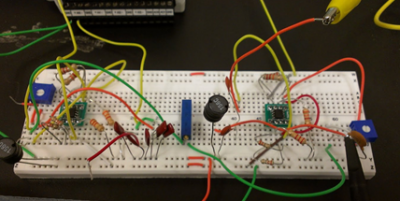
Figure 1 shows a picture of the circuit. Here there are actually two Chua circuits on one circuit board, but all of the experiments were carried out using only one. The project to study how two Chua circuits coupled together, either electrically or acoustically, was abandoned to study the dynamics of a single Chua circuit. As it turns out, the dynamics of a single Chua circuit are complex enough to merit further study.
Chua’s circuit was hooked up to an oscilloscope and external computer that sampled the voltages across the two capacitors at 48,000 samples per second. Data was collected for several different values of the variable resistance.
Parts
- 3 - 10 nF Capacitors
- 3 – 100 nF Capacitors
- 3 – 15 mH Inductors
- 3 – Variable Resistors in kΩ range
- 6 – 220 Ω Resistors
- 6 – 22 kΩ Resistors
- 3 – 2.2 kΩ Resistors
- 3 – 3.3 kΩ Resistors
- 6 – MA23L3 Ultrasonic Transducers (not used)
- 3 – TL082
The Equations
- <math>\frac {dx}{dt} = α[y - x - g(x)]</math>
- <math>\frac {dy}{dt} = x - y + z</math>
- <math>\frac {dz}{dt} = -βy</math>
x(t) is the voltage across C1, y(t) is the voltage across C2, and z(t) is the current across L. α and β depend on the values of the various circuit components. The function g(x) is the source of the non-linearity, and it depends on the specifications of Chua's diode. The IV curve of a Chua's Diode is shown in Figure 2, and this is the piece-wise g(x) function used in the equations. For simulations of these equations, see references [1] and [4].
Experimental Results
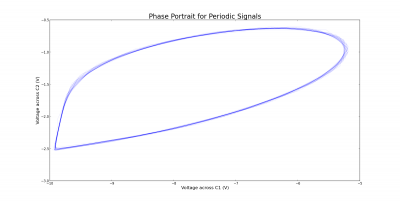
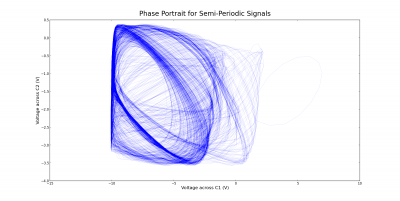
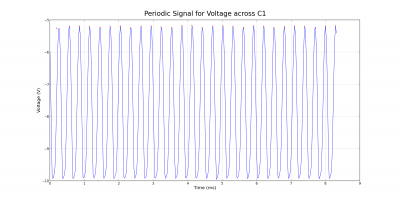
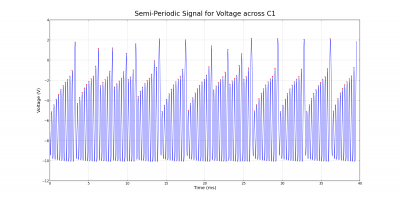
There are several different routes to chaos in Chua’s circuit. In the experiment, the route observed was periodic behavior, followed by a “screw attractor”, and finally chaotic behavior, referred to as a “double scroll” in Chua’s circuit [11]. This contrasts to period doubling, whose requirements of the function g(V) did not meet the specifications of our circuit [12]. The meaning of a “screw attractor” is most evident by looking at the phase space diagram for the two voltages in figure 5. Out of the periodic behavior, a single chaotic attractor was born as the resistance increased. This may be referred to as “semi-periodic” behavior, meaning that it is almost periodic, but has some chaotic aspects.
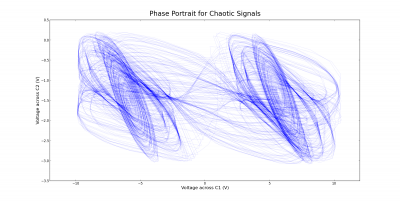
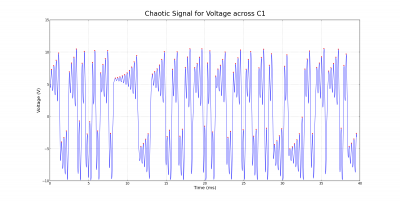
When the resistance was increased further, another attractor was born, forming a double scroll. The phase portrait for this behavior is shown in Figure 6. Trajectories in phase space are confined to this double scroll and orbit around these two attractors in a complicated way. It is this complicated behavior that we wish to analyze.
 |
 |
 |
The periodic and chaotic behavior can also be observed by looking at voltage-time plots instead of phase space diagrams. The corresponding cases for the voltage across the capacitor C1 are shown below. Notice the differences between the semi-periodic and chaotic plots. Although the semi-periodic plot appears to be somewhat chaotic and irregular, it is not as definite as the chaotic plot.
 |
 |
 |
Lyapunov Exponent
The Lyapunov exponent is a measure of how two nearby trajectories diverge over time.
- <math>|δ Z(t)| = e^{λt} |Z(0)|</math>
If the value is positive, then any two nearby trajectories diverge exponentially, and chaos results. If the value is negative, then two trajectories converge exponentially and chaos is not observed. Knowing the Lyapunov exponent for a system is a good measure of how chaotic the system is.
 |
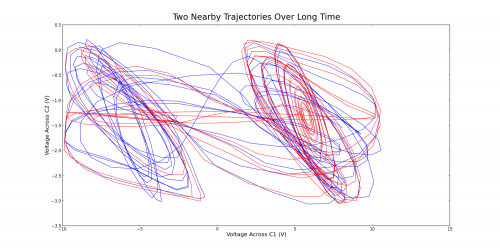 |
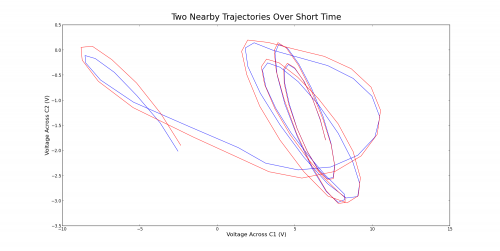
Two nearby points were chosen in phase space by scanning the data and finding any two points that were separated by no more than 0.0075 V across each capacitor. These two points were of course separated in time by quite a bit. Finding points any closer would prove difficult or impossible despite having data collected over about ten seconds (an incredible amount of time for the dynamics of the circuit, which can change rapidly on the order of a millisecond). Two nearby trajectories in phase space are shown in figure 10 over a short time. In such a time, these trajectories are nearly locked on and only separate by a small amount in the end. Figure 11 shows the two trajectories over a long time. By this time, the trajectories have completely different behavior and no longer resemble each other. The system is chaotic, for a small separation in initial conditions has grown to something enormous. Figure 12 emphasizes the divergence by showing how the two trajectories compare on the voltage-time plot. They begin locked on, but after a few milliseconds they take on completely different behavior.
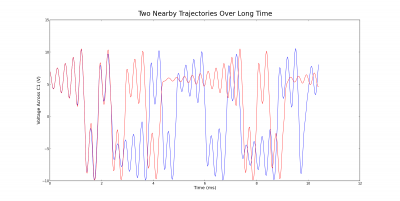
A true description of two nearby trajectories requires n Lyapunov exponents in n-dimensional space. Each independent variable contributes to the total chaos of the system. This was not the method used here. Instead, the maximal Lyapunov exponent was measured. The maximal Lyapunov exponent is a measure of how the distance between two nearby trajectories in phase space diverges in time [7].
Only a single value for the Lyapunov exponent is obtained using this method. However, the Lyapunov exponent depends on the initial conditions and therefore depends on which attractor the trajectories start in, since the two attractors are not identical [7]. So two Lyapunov exponents are expected, one for each attractor. In determining the Lyapunov exponent for each attractor, it was important to ensure that these trajectories did not leave the attractor they started in too quickly. Otherwise, the calculated value would be influenced by both attractors. Keeping in mind that the Lyapunov exponent varies in phase space, an average Lyapunov exponent can be defined for the whole system.
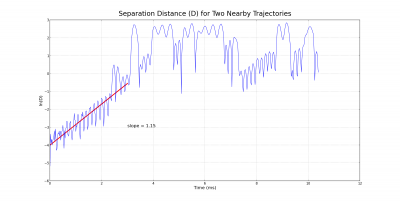
The Lyapunov exponent is determined by plotting the log of the distance between the two trajectories as a function of time. As a result, linear behavior is expected. One of these plots is shown in Figure 13 and a line is fitted to the first part. There is a saturation point where the linear behavior disappears because the trajectories are confined to the attractor.
This procedure was done for a number of initial conditions (each of which do not leave the attractor they start in too quickly) and an average was calculated for each attractor. The left attractor and right attractor have an average Lyapunov exponent of 1.0 and 1.7, respectively. These averages have a standard deviation of around 0.3, although the dependence of the Lyapunov exponent on position in phase space implies the distribution isn’t normal anyways; there is some natural variance in the system. The variance obtained is due to this, but also due to the inexact measurement of the Lyapunov exponent, for there is no exact method for fitting a line to the curve.
In addition, a t_horizon was defined from the average Lyapunov exponent of the system, 1.33 [7].
<math>t \sim~ O\left(\frac {1}{λ} ln \left(\frac {a}{||δ||}\right)\right)</math>
Here, a is the tolerance level, chosen to be 0.1 V, and δ is the uncertainty in measurement, chosen to be 0.001 V. The t_horizon comes out to 3.46 ms. So after this time, the uncertainty has grown to 0.1 V. This is only a rough model.
Iterative Maps
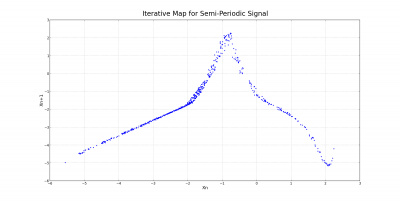
Motivation from the Lorenz equations suggests that there might be some basic relationship between successive maxima in the voltage-time plot for chaotic behavior. Although Chua's equations are different from the Lorenz equations, some of the results are quite similar. Because the behavior for the chaotic case was quite different across the two capacitors C1 and C2, two distinct iterative maps were constructed. For the screw attractor, only one was necessary. These three maps are shown below.
 |
 |
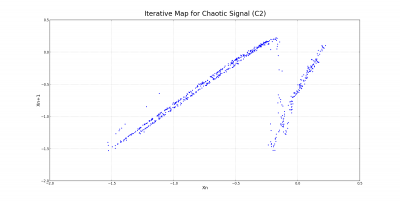 |
The iterative map for the screw attractor resembles the tent-like shape observed in the Lorenz system. While the iterative maps for the two chaotic cases are quite different, there seems to be a definite relationship between the value of a given maximum and the value of the one after it.
Attractor Reconstruction
The idea behind attractor reconstruction is that the full 3-D phase space can be reconstructed from the measurement of only one variable. The method suggests that information about each independent variable is not self-contained (ref = strogatz). The method relies on a delay time and reconstructs the data according to the following equations:
<math>X = X(n) Y = X(n + τ) Z = X(n + 2τ)</math>
If the right delay time is chosen, then the attractor may be reconstructed. An optimal time choice is one that minimizes mutual information between the signal and its time-delayed signal (ref = Fraser and Finney, 1986).
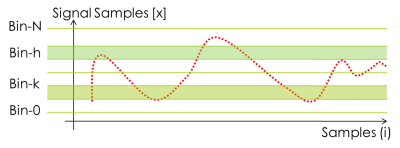
The mutual information can be calculated as follows. Assuming that the range of the signal is divided into N sections and <math>X_i</math> are the samples of the signal, we define <math>P_h</math> and <math>P_k</math> as the probabilities that <math>X_i</math> assumes a value inside the <math>h^{th}</math> and <math>k^{th}</math> sections respectively. We also define <math>P_{h,k}(t)</math> as the joint probability that <math>X_i</math> and <math>X_{i+t}</math> are in sections h and k. These probabilities are determined by taking the number of samples that fall in a given section and dividing by the total number of samples. The mutual information can then be given by
<math>I(τ) = - \sum_{h}^j \sum_{k}^j P_{h,k}(τ)ln \frac{P_{h,k}(τ)}{P_h P_k}</math>
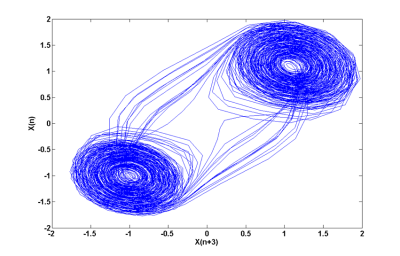
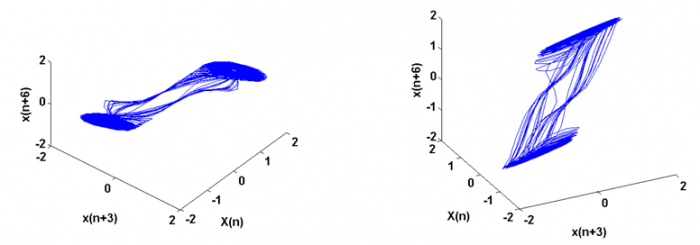
Using this method, we were able to reconstruct the attractor in two and three dimensions. The reconstructed attractor in 2-D is shown in figure (10). We see that a double scroll has been created in phase space, and only the voltage across one of the capacitors was needed. A double scroll is reconstructed in 3-D as shown in figure (11).
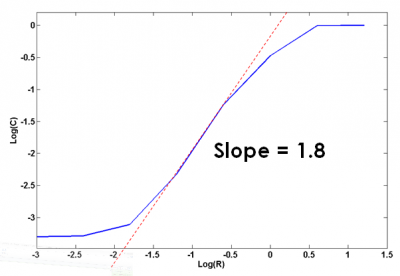
We also calculated the correlation dimension, which is a measure of the fractal dimension of the attractor. Having a finite number of points N on the attractor, the correlation dimension can be evaluated using the following formula
<math>C(R) = \lim_{N \to \infty} \frac{a}{N^2} \sum_{i,j = 1}^N H(R - |X_i - X_j|) </math>
Here, R is the radius of a circle in the plane, and it this parameter which is varied. The correlation dimension can then be calculated by plotting C as a function of R on a log-log plot. This plot is shown below the dimension is given by the slope of the dotted line, 1.8.
Simulation
In addition to the experimental component of this project, a simulation for Chua’s circuit was also designed. The equations governing Chua’s circuit are found under the Design and Parts.
These were solved using an adaptive Runge-Kutta fourth order method. The advantage of the simulation over experiment is that any of the three variable can determined to a high degree of accuracy. This bypassed the need of an attractor reconstruction, but also enabled a comparison of simulated data to calculations. Although we did not do a rigorous comparison of the two, the simulation did generate results that were comparable to those obtained in the results. Similar attrators were observed in 2D and the 3D image compared to the reconstructed scroll from the data.
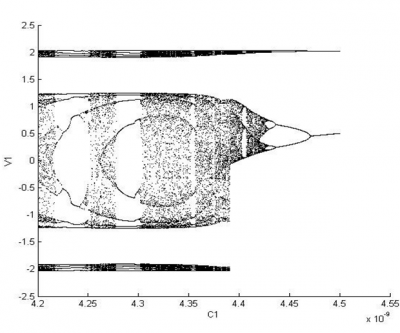
Another advantage of the simulation is the ability to run the experiment for any value of the resistance and tweak other values of the circuit components. This enabled the simulation to construct a bifurcation diagram for a circuit that meets the criteria for period doubling, a behavior unobservable in our experiment. The diagram is shown in figure (12) and plots the possible voltage values as a function of the capacitance.
Conclusion
In summary, we have identified one of the routes to chaos for Chua’s circuit, which is going from periodic behavior to screw attractor and finally to chaos. We also found the Lyapunov exponent of the Chua’s circuit to be around 1.33, averaged between the left (1.01) and right (1.65) attractor. Last but not least, the correlation dimension of the circuit was computed to be 1.8. With the help of the computer simulation, we are certain that Chua’s circuit can produce period doubling with the correct parameters. To further investigate the nonlinear dynamics of Chua’s circuit, more data needs to be collected from different configurations of the circuit. With a change of the resistances inside the nonlinear resistor, the Chua’s circuit would be capable of period doubling. With the proper equipment, the current passing through the inductor can be measured so that all three variables are measured.
Chua’s circuit has within it many complex behaviors that demonstrate the aspects of chaotic behavior. Because it is so simple to build and play around with, the circuit is widely used to generate chaotic output in the laboratory. Although it is so widely used, it is still not fully understood, for the complexities of the circuit are far too deep. The purpose of this experiment was to demonstrate and apply various methods in nonlinear dynamics to the circuit in hopes of shedding some light on the complexities observed.
There are a host of other things that can be done with Chua’s circuit. One thing we would like to do is to construct greater comparisons between simulation and experiment. For instance, it is known that the Lyapunov exponent varies depending on the trajectory chosen, i.e. it has a spatial dependence. The simulation could answer such questions as “How large is this variance for different points all across the attractor?” This could then be compared to the variance obtained in calculating the Lyapunov exponent, and possibly explain why such a variance was observed. An even bigger goal for the future is getting back to our initial objective and synchronizing multiple Chua’s circuits acoustically, and thus help the security of communication.
References
Websites
Literature
- [7] S. H. Strogatz, Nonlinear Dynamics and Chaos: With Applications To Physics, Biology, Chemistry, And Engineering (Studies in Nonlinearity). Westview Press, 2001, p. 512.
- [8] K. Cuomo, “Synchronization of Lorenz-based chaotic circuits with applications to communications,” Circuits and systems II: …, vol. 40, no. 10, pp. 626–633, 1993.
- [9] P. Arena, A. Buscarino, L. Fortuna, and M. Frasca, “Separation and synchronization of piecewise linear chaotic systems,” Physical Review E, vol. 74, no. 2, pp. 1–11, Aug. 2006.
- [10] H. Dedieu, M. Kennedy, and M, Hasler, "Chaos shift keying: modulation and demodulation of a chaotic carrier using self-synchronizing chua's circuits," Circuits and systems II: Analog and digital signal processing, IEEE Transactions on 40, 634-642 (1993)
- [11] Y. Harada, K. Masuda, and A. Ogawa, “Dynamical behavior of acoustically coupled chaos oscillators,” Fractals-an Interdisciplinary …, 1996.
- [12] L. Chua and L. Huynh, "Bifurcation analysis of chua's circuit," in Circuits and Systems, 1992. Proceedings of the 35th Midwest Symposium on (IEEE, 1992) pp. 746-751.
- [13] A. Fraser and H.Swinney, "Independednt coordinates for strange attractors from mutual information," Physical review A 33, 1134 (1986).
