Group 2 2014: Difference between revisions
Faraday2014 (talk | contribs) |
Faraday2014 (talk | contribs) |
||
| Line 31: | Line 31: | ||
===Data Collection Procedure=== | ===Data Collection Procedure=== | ||
<iframe width="560" height="315" src="//www.youtube.com/embed/xYonD_TS0_0?list=UUTT5_sfMeq7I7tATTt-WrJg" frameborder="0" allowfullscreen></iframe> | |||
=Data Analysis= | =Data Analysis= | ||
Revision as of 16:06, 12 December 2014
Members: Bollenbacher, Chambers, Cunningham, Putzel
Introduction
First observed by Michael Faraday in 1831, Faraday waves are instabilities in the surface of a liquid arising at a fluid undergoing vertical oscillations above a critical amplitude and/or frequency. Faraday himself measured that the resulting surface wave frequency was equal to half the driving frequency. Above this critical amplitude/frequency the fluid surface can exhibit an incredible variety of patterns as well as spatial and temporal chaos and combinations of the two, attracting the attention of mathematicians and physicists alike. The precise patterns and critical values are highly dependent on boundary conditions (container geometries) and the properties of the fluid itself for example viscosity and surface tension. Beyond the mere satisfaction of mathematical curiosity, Faraday waves have several practical applications and have made contributions to other areas of physics. They play a role in the amplification of earthquakes through looser sediments and can allow one to deposit a film of material in a desired pattern through forming the wave, letting the material settle and the excess liquid of the suspension to evaporate; such a skill has interesting applications in creating more precise optical instruments. In the field of quantum mechanics, Faraday waves have recently been observed in Bose-Einstein Condensates and there is a curious analogy one can make between a probability wave distribution in quantum mechanics and a 'walking' droplet guided by a precisely tuned Faraday wave. When confined to a circular container, an oil droplet can be made to bounce on a water surface supporting a Faraday wave within a small range of driving frequency and amplitude. Within an even narrower parameter range, the Faraday wave can guide the oil droplet in a random walk across the surface. This results in a probability distribution for the droplet reminiscent of the wave function of an atom confined in a circular geometry. The particle/wave guide pair also exhibits many effects similar to those predicted by quantum physics such as tunneling and bears a striking resemblance to wave/particle duality. These similarities have left many speculating that there may be a hidden variable theory for quantum mechanics that mimics the pilot wave in the walking droplet experiment.
Background Knowledge
Though the Faraday instability has been studied for nearly 200 years, it is still not fully understood. There has been much work done both experimentally and theoretically characterizing the surface waves\cite{ZhangVinals}\cite{Douady} but flow in the fluid body has not been given so much attention. The evolution of the vector flow field in a fluid is governed by the Navier-Stokes equation. \begin{equation} \hspace{0.5cm}\frac{d\vec{u}}{dt}=-\frac{1}{\rho}\nabla{P}+\vec{g}(t)+\frac{\mu}{\rho}\nabla^2{\vec{u}} \end{equation} with $\vec{u}$ the velocity field, $P$ the pressure, $\rho$ and $\mu$ are density and viscosity respectively and $\vec{g}(t)=\vec{g}+\vec{\epsilon} cos(\omega t)$ the effective gravity which acts in the $z$ direction. This is derived strictly from momentum conservation in a fluid and to fully describe the flow, more information is required. The supplementary equations are usually the mass continuity equation, \begin{equation} \frac{\partial\rho}{\partial t}+\nabla\cdot(\rho\vec{u})=0 \end{equation} and a set of well-defined boundary conditions. For many situations, including our experiment, we can assume the fluid is incompressible which simplifies the mass continuity equation to $\nabla\cdot(\vec{u})=0$.
In almost every real situation, equations (1) and (2) and the boundary conditions become a system of non-linear partial differential equations. Solutions can therefore almost exclusively be achieved numerically. There is a large variety of software packages for solving Navier-Stokes computationally.
Goals
The experiment will investigate the fluid flow $\vec{u}$ evolution at the onset of the Faraday instability. We hope to collect and analyze data about the flow field at this bifurcation point and at the transition marking the onset of chaotic motion. We will do this by using PIV methods to image the fluid as the frequency and amplitude of vibrations are changed. While the surface waves of Faraday waves are commonly studied, there are few experiments which focus on the internal flow fields occurring beneath the surface of the fluid. There have also been several observations of secondary flows in Faraday wave experiments\cite{secondflow1} and we may be able to see this also. Alongside the experiment we will simulate the initial and boundary conditions using a software package and numerically solve Navier-Stokes in order to compare this to our results and evaluate the accuracy of the simulation. As far as we are aware, no experiment such as this has been conducted.
Methodology
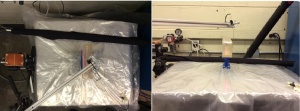
Experimental Apparatus
Data Collection Procedure
<iframe width="560" height="315" src="//www.youtube.com/embed/xYonD_TS0_0?list=UUTT5_sfMeq7I7tATTt-WrJg" frameborder="0" allowfullscreen></iframe>
Data Analysis
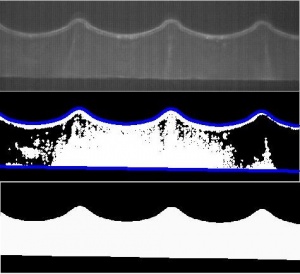
Video Processing
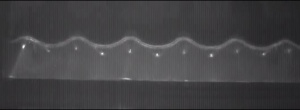
Analysis of Results

Conclusion
