Group 1: Difference between revisions
No edit summary |
No edit summary |
||
| Line 57: | Line 57: | ||
: [5] J. Bechhoefer and B. Johnson, Am. J. Phys, 64, 12 (1996). <http://arxiv.org/pdf/patt-sol/9605002v1> | : [5] J. Bechhoefer and B. Johnson, Am. J. Phys, 64, 12 (1996). <http://arxiv.org/pdf/patt-sol/9605002v1> | ||
: [6] A. Kudrolli and J.P. Gollub, Physica D 97, 133 (1996) | : [6] A. Kudrolli and J.P. Gollub, Physica D 97, 133 (1996) | ||
: [7] Florian S. Merkt, Robert D. Deegan, Daniel I. Goldman, Erin C. Rericha and Harry L. Swinney, PRL 92, 184501 (2004) | : [7] Florian S. Merkt, Robert D. Deegan, Daniel I. Goldman, Erin C. Rericha and Harry L. Swinney, PRL 92, 184501 (2004) <https://www.physics.gatech.edu/files/u347/public/prl84501.pdf> | ||
Revision as of 04:11, 20 October 2011
Faraday Waves and Nonlinear Patterns
Background
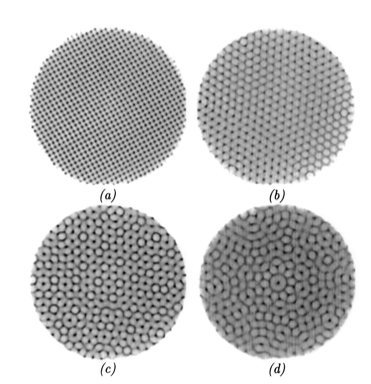
- Eponymously discovered by Faraday[1], Faraday Waves are standing waves on a fluid caused by vertical oscillatory motion. At given frequencies, these standing waves (vibrating at held the driving frequency) give surface patterns of n dimensional rotational symmetry; mainly square, hexagonal, and 8-fold quasi-static patterns. The wavelength of the standing waves are a function of viscosity, surface tension and density. Hence, understanding the relationship between these variables and the wavelength, will allow oscillation frequencies to be selected that produce standing waves of order n [2]:

a) n=2 (square symmetry) b) n=3 (hexagonal symmetry) c) n=4 (8-fold quasiperiodic) d) n=5 (10-fold quasiperiodic)
Previous Experiments
Binks and van de Water [2] choose to examine the stability of faraday waves as a function of excitation frequency. The wavelength of each mode can be determined from the inviscid deep fluid dispersion relation: ![]() where:
where:
![]() (g is acceleration due to gravity, k is the wave number, and 2w is the excitation frequency)
(g is acceleration due to gravity, k is the wave number, and 2w is the excitation frequency)
![]() (alpha is the surface tension, and rho is the density)
(alpha is the surface tension, and rho is the density)
Furthermore, the theory of this experiment is only valid for gamma << 1 where gamma is
![]() , the inverse Reynolds number.
, the inverse Reynolds number.
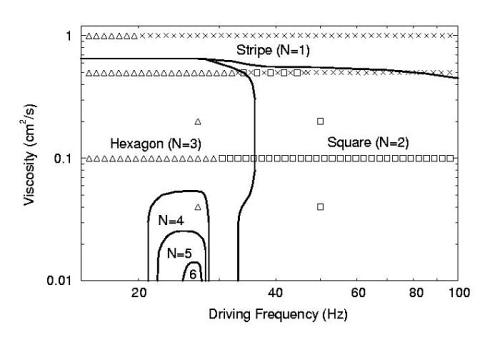
With these values, Binks and Water varied the amplitude of the oscillations for different frequencies and plotted the stable points on a phase diagram. In between each stable standing wave was a mixture of both waveforms. These transitionary states were shown to be bicritical points. Peilong and Vinals [4] were able to select stable points as a function of driving frequency and viscosity and plot them in a graph as shown:

Non-Newtonian Fluids
Non-Newtonian fluids have the property that its viscosity is not constant as stress is applied to it over time. However, with a high enough amplitude and driving frequency, it is still possible to observe faraday waves in these fluids. It is even possible for holes to be created inside fluids such as cornstarch when undergoing vertical oscillation (Goldman [7]).
Experiment
This experiment is designed to reproduce the results of quantifying the observance of these waves by Binks and W. van de Water [2]. The expected results should also agree with Zhang and Vinals' [3] prediction of the amplitudes of the standing waves. The experiment will go a step further and not only test the theory out for different fluids (including a non-newtonian fluid), but for different oscillatory patterns (square, sinusoidal,and triangle) .

- Reproduce the experiments of Binks and Van de Water
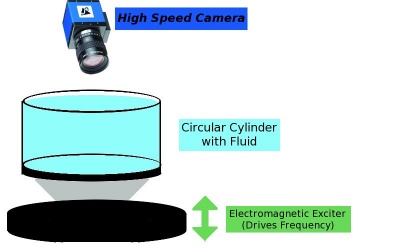
- Fill a 440 mm diameter circular container with 20 mm height of experimental fluid
- Attach a 2 cm thick plate on the bottom of the container and a hollow conical structure attached to an electromagnetic exciter below that.
- Place piezo-electric accelerometers on the cone (one on bottom, two on top) to measure the acceleration cone. This allows control of the oscillation frequency.
- A high speed CCD camera is placed above the container to take snapshots of the standing waves. It is required that the frames per second of the snapshots are greater than the oscillation period of the standing waves.
- The amplitude of the oscillations are controlled by the electromagnetic exciter and increased in small steps (about 1%) where each wave is held for 2000 seconds first before taking 1000 s of images of the waves.
- Measurements of the amplitude of the waves are taken by a laser
- Compare the amplitudes and patterns with theory as a function of driving frequency
- Repeat experiment with another fluid, and a non newtonian fluid and checking if theory is consistent across different fluids.
- Observe the effects of changing the wave form on the standing waves
- Sinusoidal Waves
- Square Waves
- Triangle Waves
Videos of Faraday Waves
Faraday Waves on Cornflour
Faraday Waves set to music
Group Members
- Juan Orphee
- Paul Cardenas-Lizana
- Michael Lane
- Elan Grossman
Sources
- [1] M. Faraday, Philos. Trans. R. Soc. London 121, 319 (1831)
- [2] D. Binks and W. van de Water, Phy. Rev. Lett. 78, 4043 (1997) <http://alexandria.tue.nl/openaccess/Metis132530.pdf>
- [3] W. Zhang and J. Viñals, Phys. Rev. E 53, R4286 (1996)
- [4] Peilong Chen and J. Vinals, Phys. Rev. Lett, 79, 2670 (1997) <http://homepages.spa.umn.edu/~vinals/mss/peilong1.pdf>
- [5] J. Bechhoefer and B. Johnson, Am. J. Phys, 64, 12 (1996). <http://arxiv.org/pdf/patt-sol/9605002v1>
- [6] A. Kudrolli and J.P. Gollub, Physica D 97, 133 (1996)
- [7] Florian S. Merkt, Robert D. Deegan, Daniel I. Goldman, Erin C. Rericha and Harry L. Swinney, PRL 92, 184501 (2004) <https://www.physics.gatech.edu/files/u347/public/prl84501.pdf>