Group 5: Difference between revisions
| Line 129: | Line 129: | ||
An example of Period-1 behavior was found at a flow rate of 0.210 mL/s. The plots below show the data after it was processed. On the left is a Poincare map of next period (Tn+1) versus current period (Tn) with the line of symmetry drawn in green. The black dots, representing the data obtained, are all clustered in one location, about six seconds. Since there is only one cluster, and this cluster lies on the line of symmetry, a period of six seconds is a fixed point for the flow rate of 0.210 mL/s. This is shown in another way in the plot on the right. Here period (Tn) is plotted versus drop count. The single horizontal line indicates that the period remains constant with each drop. | An example of Period-1 behavior was found at a flow rate of 0.210 mL/s. The plots below show the data after it was processed. On the left is a Poincare map of next period (Tn+1) versus current period (Tn) with the line of symmetry drawn in green. The black dots, representing the data obtained, are all clustered in one location, about six seconds. Since there is only one cluster, and this cluster lies on the line of symmetry, a period of six seconds is a fixed point for the flow rate of 0.210 mL/s. This is shown in another way in the plot on the right. Here period (Tn) is plotted versus drop count. The single horizontal line indicates that the period remains constant with each drop. | ||
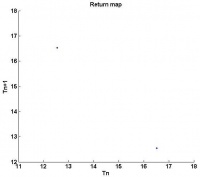
Next, an example of Period-2 behavior was found at a flow rate of 0.319 mL/s. Once again there are two plots below showing the processed data: on the left, a Poincare map, and on the right, a time series. The Poincare map now exhibits two distinct clusters, one a little under four seconds and the other a little under four and a half seconds. This indicates that the period alternates between these two values. To make this clearer, consider the following line of events. A pair of drops falls with a period of four seconds, which if looking at the x-axis (Tn) places us in the upper left cluster of the map. Reading the y-axis (Tn+1) dictates that the next period will be four and a half seconds. Returning to the x-axis, we are now in the lower right cluster of the map. Finally, reading the y-axis dictates that the next period will be four seconds which returns us to our initial period. The plot on the right shows two horizontal lines representing the two alternating values of period. | Next, an example of Period-2 behavior was found at a flow rate of 0.319 mL/s. Once again there are two plots below showing the processed data: on the left, a Poincare map, and on the right, a time series. The Poincare map now exhibits two distinct clusters, one a little under four seconds and the other a little under four and a half seconds. This indicates that the period alternates between these two values. To make this clearer, consider the following line of events. A pair of drops falls with a period of four seconds, which if looking at the x-axis (Tn) places us in the upper left cluster of the map. Reading the y-axis (Tn+1) dictates that the next period will be four and a half seconds. Returning to the x-axis, we are now in the lower right cluster of the map. Finally, reading the y-axis dictates that the next period will be four seconds which returns us to our initial period. The plot on the right shows two horizontal lines representing the two alternating values of period. | ||
Next, chaos was found in a range of flow rates. The plot below shows period versus drop count at a flow rate of 0.374 mL/s. Notice the seemingly random behavior. Although the range of periods appears to be bounded between about three and a half and four seconds, there does not seem to be any predictable pattern. | Next, chaos was found in a range of flow rates. The plot below shows period versus drop count at a flow rate of 0.374 mL/s. Notice the seemingly random behavior. Although the range of periods appears to be bounded between about three and a half and four seconds, there does not seem to be any predictable pattern. | ||
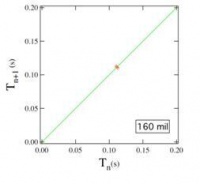
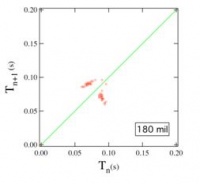
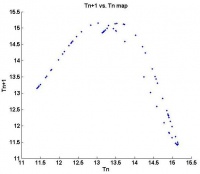
However, in the Poincare map, beautiful attractors emerge. Below are three Poincare maps for three different flow rates. Even though the flow rates are different, notice the similarity in the attractors. They all seem to have an “M” shape. The plot on the far right was actually obtained from using a different nozzle diameter which would explain its slight difference in shape. | However, in the Poincare map, beautiful attractors emerge. Below are three Poincare maps for three different flow rates. Even though the flow rates are different, notice the similarity in the attractors. They all seem to have an “M” shape. The plot on the far right was actually obtained from using a different nozzle diameter which would explain its slight difference in shape. | ||
Finally, an example of Period-3 behavior was found at a flow rate of 0.365 mL/s. Once again there are two plots below showing the processed data: on the left, a Poincare map, and on the right, a time series. The Poincare map now exhibits three clusters indicating that the period cycles between these three values. To make this clear, consider starting with a period of about 3.9 seconds, which places us in the bottom right cluster. The y-axis dictates the next period will be about 3.5 seconds. Returning to the x-axis, this places us in the far left cluster. The y-axis now dictates that the next period will be about 3.8 seconds. Once again, returning to the x-axis places us in the upper, middle cluster. Finally, the y-axis dictates a return to a period of 3.9 seconds. | Finally, an example of Period-3 behavior was found at a flow rate of 0.365 mL/s. Once again there are two plots below showing the processed data: on the left, a Poincare map, and on the right, a time series. The Poincare map now exhibits three clusters indicating that the period cycles between these three values. To make this clear, consider starting with a period of about 3.9 seconds, which places us in the bottom right cluster. The y-axis dictates the next period will be about 3.5 seconds. Returning to the x-axis, this places us in the far left cluster. The y-axis now dictates that the next period will be about 3.8 seconds. Once again, returning to the x-axis places us in the upper, middle cluster. Finally, the y-axis dictates a return to a period of 3.9 seconds. | ||
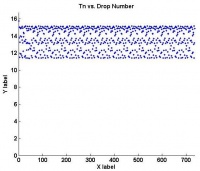
However, compared to Period-1 and Period-2, there seems to be a fair amount of points lying outside of the three clusters. This can be explained by looking at the plot on the right of period versus drop count. There are regions where the three horizontal lines are distinct and then regions of apparent chaos. This is actually the system exhibiting transient chaos. Since Period-3 is a periodic window within the range of chaos, the system may sway both ways if it is on the border. This plot clearly indicates a swaying between Period-3 behavior and chaotic behavior. | However, compared to Period-1 and Period-2, there seems to be a fair amount of points lying outside of the three clusters. This can be explained by looking at the plot on the right of period versus drop count. There are regions where the three horizontal lines are distinct and then regions of apparent chaos. This is actually the system exhibiting transient chaos. Since Period-3 is a periodic window within the range of chaos, the system may sway both ways if it is on the border. This plot clearly indicates a swaying between Period-3 behavior and chaotic behavior. | ||
Revision as of 15:12, 13 December 2011
Group members: Joshua Job, Ricky Patel, Nick Pritchard, Caleb Royer

Abstract
The dripping faucet experiment seeks to provide a relatively simple visualization of a system that exhibits seemingly predictable dynamics that quickly transitions to an entirely unpredictable, chaotic behavior under certain conditions. Through a straightforward experimental setup, the time between drips of a faucet is measured using a photodiode and a laser. The number of drips are dictated through precise control of the faucet head of reservoir control. This could be achieved by changing the flow rate or altering the water level of the reservoir tank that supplies the water. The photodiode records this drop as the water drop temporarily distorts the laser path to the diode. The photodiode is interfaced to a computer through an analog to digital converter. The data is easily analyzed and visualized through the computer.
The behavior of the chaotic dripping faucet is described by the following equation, where d(m)/dt=Q=flow rate, g is the acceleration due to gravity, k is the spring constant (coming from surface tension), b is the drag force (coming from viscosity), and v=dy/dt:
- <math>
\begin{aligned} \frac{d(mv)}{dt} & =\ mg-ky-bv \\ \end{aligned} </math>
The expected results show two main regimes: a period doubling regime, and a chaotic regime. The system gradually transitions from a single period to double period, followed by four periods. Once the flow rate is increased past these period doubling regimes, the time between drips becomes apparently unpredictable. Plotting the current period against the next period, the outwardly chaotic behavior begins to show signs of an attraction basin. This represents a classic example of chaotic behavior of a system that seems to contain easily understandable system dynamics and physical phenomena. Additionally, the seemingly random behavior after the initial period doubling also shows the basins of attractions that seem to exist for the chaotic regime.
Background
The simplest model for the chaotic dripping faucet is that of a mass-spring system described in “The Chaotic Behavior of the Leaky Faucet” (Martien, Pope, Scott, Shaw 1985). This system uses a simple differential equation of a mass-spring system whose mass increases linearly with time. When the position of the center of mass of the drop reaches a critical value, the mass of the drop is reduced proportionately to the velocity of the drop, and the model continues. This simulates the pinching off of the droplet. Physically, this model is an intuitive description of the system: the water droplet is a mass, and it is being driven by the flow of water into it (which increases its mass linearly with time), which has some restoring force due to surface tension and some drag due to viscosity. The equation of motion for this model is:
- <math>
\begin{aligned} \frac{d(mv)}{dt} & =\ mg-ky-bv \\ \end{aligned} </math>
where d(m)/dt=Q=flow rate, g is the acceleration due to gravity, k is the spring constant (coming from surface tension), b is the drag force (coming from viscosity), and v=dy/dt. This model has been the most popular for the chaotic dripping faucet since its introduction. However, it is not very precise, and gives very little information about what are the appropriate values of k and b (as well as the critical y value, or the constant of proportionality between the momentum prior to pinch-off and the mass after pinch-off). This renders it a good qualitative model (exhibiting period doubling and transitions into chaos for some regions in the parameter space), and simple pedagogically, but not particularly accurate in an experimental context. To rectify this, some ( Kiyono & Fuchikami 1999, Coullet, Mahadevan & Riera 2005) have employed far more detailed hydrodynamical models of the flow, using simplified versions of the Navier-Stokes equations. These models are far more accurate, but due to their added complexity, they are of limited use for gaining an intuitive understanding of the dynamics. Kiyono and Fuchikami put used numerical simulations based on one such hydrodynamical model to produce a modified version of the mass-spring system, this time including well-defined parameters gleaned from the simulations. Their equation of motion is:
- <math>
\begin{aligned} m\ddot{z} +(\dot{z} -v_0)\dot{m} & =\ -kz-y\dot{z}+mg \\ \end{aligned} </math>
where z is the position of the center of mass, v0 is the velocity of the flow, dm/dt=πa2v0 where a is the radius of the aperture, y is the drag force, and g is acceleration due to gravity.In their paper, Kiyono & Fuchikami adopt a set of geometrized units such that g=1. For water at twenty degrees centigrade, these units are l0=0.27 cm, t0=0.017 s, m0=0.020 g, P0=270dyn/cm2. For a faucet 5 mm in diameter this yields a radius a=0.916 and the viscosity is 0.002. From their numerical simulations, they arrived at y=0.05, k(m)=-11.4m+52.5 if m<4.61 or 0 if m≥4.61. When the center of mass passes through zcrit=5.5 with a positive velocity (i.e. traveling downward), they reset m as mnew=0.2m+0.3, and znew=z0=2.0 and dz/dt=0. Together, these equations and values compose their full model for a faucet 5 mm in diameter operating at twenty degrees centrigrade. This model provided good agreement with their more exact hydrodynamical simulations, and exhibited period doubling and the transition to chaos in agreement with experiment. The mass of the droplet at each pinch-off event uniquely determines the mass of the next droplet, making this model a one-to-one mapping (the simplest that can exhibit chaos). For a numerical prediction, they find that the period of one full cycle obeys the function Tn=1.276 v0-1 + 3.9 (actually, they find two equations that parameterize Tn and v0 based on the frequency of single-period oscillation in their bifurcation diagrams, this equation is arrived at by eliminating the parameterization). Their model also shows hysteresis, and multiple regions where there is a transition to chaos.
Previous Research
Experimental Apparatus
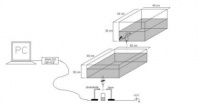
This experiment was first performed by Robert Shaw in 1984. He used it as a simple example of a dynamical system whose behavior starts completely predictable and then transitions into an unpredictable, chaotic state. The experiment has since been repeated a multitude of times. The apparatus is fairly similar in all cases and is shown in the figure to the right.
The faucet is replicated using a reservoir to hold the fluid and a valve to finely adjust the flow rate. A second reservoir can be used to keep the hydrostatic pressure of the first reservoir constant. To measure the time between drips, a laser and photodiode are lined up so that the beam is blocked by water droplets. The signal from the photodiode is fed through an analog to digital converter to a computer. Data is then recorded as the time between drips.
Expected Results
We can expect to see two regimes: first, a period doubling regime, and second, a chaotic regime. By slowly and precisely increasing the fluid flow rate, the system will progress from period-1 to period-2 to period-4, etc. By plotting the data as Tn+1 vs Tn, clusters will appear depending on the period.
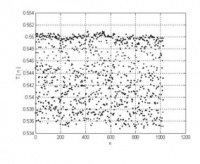
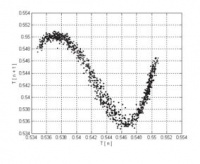
As the fluid flow rate is increased past the period-doubling regime, chaotic behavior emerges. The time between drips is unpredictable as can be seen in the figure of Tn vs n below. However, when the data is plotted as Tn+1 vs Tn, a strange attractor appears:
Procedure
The experiment will be set up as follows:
1. Feeder tank fills the reservoir tank.
2. Reservoir tank drips though stopcock with needle nose valve. The flow rate, or rate of drops falling, is the controlled parameter in this setup. The feeder tank fills the reservoir tank at the same flow rate in order to maintain constant hydrostatic pressure in the reservoir tank.
3. A circuit is implemented to amplify signals and reduce noise. This circuit uses a Schmitt trigger to reduce noise and op-amp to amplify the signal. The signal is the read by an Analog to Digital Converter (ADC) and brought into the computer software realm. The sampling rate of the ADC will be high enough to capture individual drops at all flow rates investigated. This will likely be in the region of 500 Hz.
4. Laser is aligned perpendicular to the direction of falling drops. A phototransistor is positioned to receive the light from the laser. As the beam is broken by falling drops, this event is captured by the phototransistor. The signal from the phototransistor is amplified by the amplifying circuit (if necessary) and the time history data acquired and digitized by the computer interface and computer. The resulting time history data is a series of pulses, with each pulse being a drop passing through the laser beam, and the period of falling drops can then be measured.
5. A high speed camera will also be used to visualize the falling drops, in addition to the laser-photodiode timing mechanism.
6. Data analysis then performed on the time history data with computer. This analysis shall primarily consist of period measurement between drops for the various flow rates, as well as plots of bifurcations, Poincare maps, and any other relevant phenomena.
Parts list
- Feeder tank
- Reservoir tank
- Stopcock with needle nose valve
- Laser
- Phototransistor or photodiode
- Breadboard circuit to amplify signals from phototransistor or photodiode
- Power supplies for laser, photodiode or phototransistor, and circuit
- High speed camera
- Analog to Digital Converter (ADC) Interface to computer
Steps
- Setup Experimental Apparatus
- Calibrate data acquisition and timing system
- Investigate dripping as function of flow rate
- Period-1 dripping
- Period-2 dripping
- Period-4 dripping
- Chaotic dripping
- Identify bifurcation parameters as dripping doubles in period
- Characterize transition from steady to chaotic dripping
- Model system as harmonic oscillator
Results
An example of Period-1 behavior was found at a flow rate of 0.210 mL/s. The plots below show the data after it was processed. On the left is a Poincare map of next period (Tn+1) versus current period (Tn) with the line of symmetry drawn in green. The black dots, representing the data obtained, are all clustered in one location, about six seconds. Since there is only one cluster, and this cluster lies on the line of symmetry, a period of six seconds is a fixed point for the flow rate of 0.210 mL/s. This is shown in another way in the plot on the right. Here period (Tn) is plotted versus drop count. The single horizontal line indicates that the period remains constant with each drop.
Next, an example of Period-2 behavior was found at a flow rate of 0.319 mL/s. Once again there are two plots below showing the processed data: on the left, a Poincare map, and on the right, a time series. The Poincare map now exhibits two distinct clusters, one a little under four seconds and the other a little under four and a half seconds. This indicates that the period alternates between these two values. To make this clearer, consider the following line of events. A pair of drops falls with a period of four seconds, which if looking at the x-axis (Tn) places us in the upper left cluster of the map. Reading the y-axis (Tn+1) dictates that the next period will be four and a half seconds. Returning to the x-axis, we are now in the lower right cluster of the map. Finally, reading the y-axis dictates that the next period will be four seconds which returns us to our initial period. The plot on the right shows two horizontal lines representing the two alternating values of period.
Next, chaos was found in a range of flow rates. The plot below shows period versus drop count at a flow rate of 0.374 mL/s. Notice the seemingly random behavior. Although the range of periods appears to be bounded between about three and a half and four seconds, there does not seem to be any predictable pattern.
However, in the Poincare map, beautiful attractors emerge. Below are three Poincare maps for three different flow rates. Even though the flow rates are different, notice the similarity in the attractors. They all seem to have an “M” shape. The plot on the far right was actually obtained from using a different nozzle diameter which would explain its slight difference in shape. Finally, an example of Period-3 behavior was found at a flow rate of 0.365 mL/s. Once again there are two plots below showing the processed data: on the left, a Poincare map, and on the right, a time series. The Poincare map now exhibits three clusters indicating that the period cycles between these three values. To make this clear, consider starting with a period of about 3.9 seconds, which places us in the bottom right cluster. The y-axis dictates the next period will be about 3.5 seconds. Returning to the x-axis, this places us in the far left cluster. The y-axis now dictates that the next period will be about 3.8 seconds. Once again, returning to the x-axis places us in the upper, middle cluster. Finally, the y-axis dictates a return to a period of 3.9 seconds.
However, compared to Period-1 and Period-2, there seems to be a fair amount of points lying outside of the three clusters. This can be explained by looking at the plot on the right of period versus drop count. There are regions where the three horizontal lines are distinct and then regions of apparent chaos. This is actually the system exhibiting transient chaos. Since Period-3 is a periodic window within the range of chaos, the system may sway both ways if it is on the border. This plot clearly indicates a swaying between Period-3 behavior and chaotic behavior.
Simulation Data
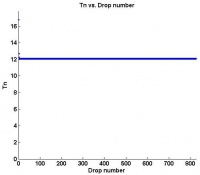
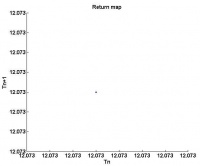
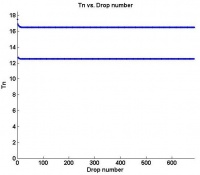
Data produced by the simulation are shown below:
 |
 |
 |
 |
 |
 |
| Period-1 Band Plot | Period-1 Map | Period-2 Band Plot | Period-2 Map | Chaotic Band Plot | Chaotic Map |
Discussion
The type of period doubling and chaotic behavior shown in the experimental data qualitatively matches data in the literature, as well as the data produced by the model. We can certainly see period doubling, chaos, all matching between simulation and experimental data and reference data from Dreyer and Hickey. There is the region of period doubling, where a consistent period bifurcates into two consistent but different periods. This single and period-2 data has been shown in the experimental results, and confirmed by this qualitatively matches the reference data. We can also see period-3 data matching the reference data.
Due to the limited resolution of the pump with the current configuration, it was not possible to take data with fine enough flow regulation to reconstruct a bifurcation diagram experimentally. However, given the type of bifurcation data produced from the simulation, it is suspected that the map is in fact not unimodal, and does not follow the U-sequence exactly. A discussion of the U-sequence and unimodal maps is given in Strogatz. Though trends are known for this system, research remains to characterize the actual bifurcation parameters of the chaotic dripping faucet.
In addition to limited flow regulator resolution, it is suspected that pump vibrations and mode interactions contributed to the difficulty reproducing period-4 data. The mechanical oscillations of the syringe pump were visible to the naked eye, but not with the final setup of pump and flow regulator. Still, patterns on a very small scale formed before period doubling with the pump, indicating some external disturbance. It is suspected that this external disturbance is induced by oscillations in the flow, due to mechanics of the flow regulator. A sinusoidal disturbance such as this could be the reason that finer regions of the bifurcation diagram could not be investigated. That is, if there is a sinusoidal disturbance on the input variable, it could cause fluctuation over the period-2/period-4/chaotic region if these regions are sufficiently narrow.
Conclusions
The data are found to follow understood period-doubling and chaotic behavior. However, additional modeling and experimental work remains to fully understand the system. Recent research has proposed modified models of the system, which seem to predict data well. However, given the limited flow regulator resolution used in this experiment, it is not definitive that these models describe the dynamics of the system, as a unimodal map with a U-sequence of bifurcations could also have produced the data shown above. In short, the bifurcations of this system still not completely understood, nor are the dynamical models completely resolved.
The lessons learned through this research should include fine attention to detail regarding the experimental setup. It is imperative to have accurate flow control and uniform flow rate. It is suggested that shunting the flow to allow finer resolution of the water passing through the nozzle, while still using the crude units of the pump, be performed in order to increase the flow rate resolution. This would allow finer investigation of the 70-90 flow-rate unit (FRU) region of the pump, where the period doubling and chaotic behavior seemed to be most apparent. Furthermore, large nozzle size is important to minimize imperfections and allow harmonic oscillator dynamics. For data collection, care must be taken to exclude satellite drops and debounce the laser-photodiode to remove the double crossings generated by falling drops.
What has been shown is that two routes to chaos appear to be confirmed, as predicted by Dreyer and Hickey. This is seen through the experimental and simulated data showing period doubling, as well as the periodic windows and transient chaos. This qualitative match between data suggest that further research be conducted to produce quantitative, and finer resolution comparisons. Overall, the model and secondary data match the literature and simulation qualitatively.
References
[1] http://www.infobarrel.com/media/image/38975.jpg
[2] Roseberry, Martha. Drip Drop: A Brief Study of the Dripping Faucet. Physics Department, The College of Wooster, 8 May 2008. Web. 18 Oct. 2011. <http://www3.wooster.edu/physics/jris/Files/Roseberry_Web_article.pdf>.
[3] Somarakis, C. E., G. E. Cambourakis, and G. P. Papavassilopoulos. "A New Dripping Faucet Experiment." Nonlinear Phenomena in Complex Systems 11.2 (2008): 198-204. National Technical University of Athens, GREECE. Web. 18 Oct. 2011. <http://www.control.ece.ntua.gr/papers/95.pdf>.
[4] K. Kiyono, N. Fuchikami, Dripping faucet dynamics by an improved mass-spring model, J. Phys. Soc. Jpn., Volume 68, 1999, Pages 3259-3270, 10.1143/JPSJ.68.3259. (http://jpsj.ipap.jp.www.library.gatech.edu:2048/link?JPSJ/68/3259)
[5] P. Martien, S.C. Pope, P.L. Scott, R.S. Shaw, The chaotic behavior of the leaky faucet, Physics Letters A, Volume 110, Issues 7-8, 12 August 1985, Pages 399-404, ISSN 0375-9601, 10.1016/0375-9601(85)90065-9.
(http://www.sciencedirect.com/science/article/pii/0375960185900659)
[6] K. Dreyer and F. R. Hickey, The Route to Chaos in a Dripping Water Faucet, Am. J. PHys, Volume 59, No. 7, 1991, pp 619-627.
[7] S. Strogatz, Nonlinear Dynamics and Chaos, Perseus, 1994.
