Group 2 2014
Members: Bollenbacher, Chambers, Cunningham, Putzel
Introduction
First observed by Michael Faraday in 1831 \cite{Fpaper}, Faraday waves are surface instabilities that arise in a fluid undergoing vertical oscillations above a critical amplitude and/or frequency. Faraday himself measured that the resulting surface wave frequency was equal to half the driving frequency. Above this critical amplitude/frequency the fluid surface can exhibit an incredible variety of patterns as well as spatial and temporal chaos and combinations of the two, attracting the attention of mathematicians and physicists alike. The pattern symmetries and critical values are highly dependent on boundary conditions, and the properties of the fluid itself (for example viscosity and surface tension).
Beyond the mere satisfaction of mathematical curiosity, Faraday waves have several practical applications and made contributions to other areas of physics. They play a role in the amplification of earthquakes through looser sediments \cite{Equake} and can allow one to deposit thin films of material in a desired pattern because small particles in the fluid are pulled towards amplitude; such a skill has interesting applications in creating more precise optical instruments \cite{nanofilm}. In the field of quantum mechanics, Faraday waves have been observed in Bose-Einstein Condensates \cite{BEC} and there is a curious analogy one can make between a probability wave distribution in quantum mechanics and a the chaotic motion of a 'walking' droplet guided by a precisely tuned Faraday wave \cite{Walkers}. When confined to a circular container, an oil droplet can be made to bounce on a water surface supporting a Faraday wave within a small range of driving frequency and amplitude \cite{bouncingdrop}. Within an even narrower parameter range, the Faraday wave can guide the oil droplet in a random walk across the surface. This results in a probability distribution for the droplet reminiscent of the wave function of an atom confined in a similar circular geometry. The particle/wave guide pair also exhibits many effects similar to those predicted by quantum physics such as tunneling and bears a striking resemblance to wave/particle duality on a macroscopic level. These similarities have left many speculating that there may be a hidden variable theory for quantum mechanics that mimics the pilot wave in the walking droplet experiment \cite{Bush2014}.
Methodology
Experimental Apparatus
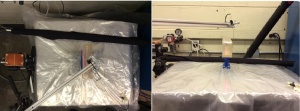
The Faraday waves were generated by mounting a container of fluid onto a shaker table capable of producing an arbitrary, vertical, forcing function. The container was transparent, excepting one of the long vertical walls to use as a backdrop for imaging. The internal dimensions of the base were 25x190mm, and the height was 100mm. This narrow profile approximates the 2D case of the Faraday wave phenomenon. The container was filled to a depth of 20mm with water mixed with a small volume of rheoscopic fluid. The ratio of this fluid to the water was determined by adding the rheoscopic fluid in small amounts until the flow pattern could be clearly seen without making the water too opaque to image.
In order to image a slice of fluid flow, a laser sheet was shone through the top of the fluid, with the plane parallel to the larger side of the container. Using a high-speed camera, we were able to capture high definition videos which we used to extract information about the internal fluid flows. The depth of the laser sheet from the front surface of the container was chosen to be large enough to not observe the surface effects at the container boundary while maximizing the amount of light that could reach the camera through the slightly opaque mixture; in our case, this proved to be about 2mm. A black cloth covered the entire apparatus to block ambient light and allow us to only image the 2D plane illuminated by the laser sheet.
Data Collection Procedure
We ran a series of experiments over a range of amplitudes, from about 0.3-0.6 g's in .05g intervals. This range of values was selected after several trial runs as the first onset occurs around 0.3g, and above 0.6g the onset process becomes too fast to observe the qualitative stages distinctly. The lower amplitude was also limited by the length of video we were able to capture at such high resolution as the bifurcation onset takes longer for lower amplitude forcing functions. The aim of taking the range was to be able to observe different features of the same process at different amplitudes. For instance, at lower amplitudes, when the onset of the waveform is slower, so perhaps this could give greater temporal resolution of the bifurcation process. We chose to stay at a single frequency, 15Hz, as this resulted in a clean formation of an integer number of waves within the length of the container.
For each trial we began by mixing the fluid to homogeneity, and allowing a moment for the flows of the stirring to damp out. Once the fluid appeared on camera to be still and uniform, we turned on the shaker table, and quickly turned up the amplitude to our target amplitude for the trial. After reaching the target amplitude, we would not adjust the forcing function until the fluid had undergone the Faraday instability and settled into a steady oscillation. Once the fluid had reached a steady state (judged qualitatively by the profile of the forcing function and the images from the camera), we turned off the forcing function and allowed the waveform to damp out. We recorded the whole process with a highs-peed camera for each trial, and then saved the video. This video was the data we collected, and all other metrics were derived from it during post-processing.
Data Analysis
Video Processing
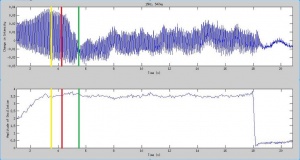
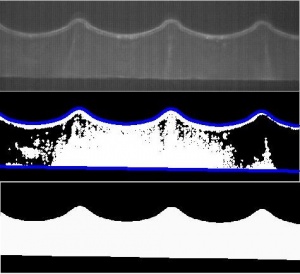
We extracted from each video two important functions: the effective forcing function, and the total reflected luminosity of the fluid as a function of time. The forcing function allowed us to account for particular transitions in the luminosity function, and the luminosity function gives us information about the internal fluid flows. The place to start to extract both functions from the video was to develop a surface tracking software. Given the position of the bottom of the container, we would be able to track the displacement in the vertical direction, and thus extract with forcing function. With the shape and location of the top surface of the fluid, we would be able to isolate the region of the fluid and integrate the total luminosity over that region.
To track these lines in the video, we looked at sharp changes in brightness, as we knew both the top and bottom surfaces were considerably brighter than their background due to reflection of the laser illumination. This method proved effective, and we were able to track both the top surface and the bottom of the container. However, because the illumination in the video was not completely uniform, we ended up cutting off the left and right edges of the video during processing, as these were slightly dimmer and disrupted the surface tracking method. This should not effect the results, however, as we were still able to have multiple full wavelengths in the frame.
After tracking these two surfaces, we were able to pull out both the forcing function and the total reflected luminosity within the fluid. We factored out the surface reflections and the visible meniscus of the fluid by chopping off a small buffer zone on the top and bottom of the region. These two functions were the major results of the current work, and proved to be quite illuminating.
Analysis of Results
Of the two functions derived from each video, the luminosity function is the key one; the forcing function merely contextualizes it. The total luminosity reflected by the fluid is an interesting metric because of the way the particles within the rheoscopic fluid behave. These particles are tiny flakes, like fish scales, which align with the fluid flow. In a still fluid, they are oriented randomly. In a fluid with 2D flow perpendicular to the line of sight, the majority of the particles align parallel to the flow such that light shone from above will not reflect toward the observer i.e. the particles have the flat face towards the observer. Further, in areas of the flow with high sheer or curl (as in the center of a convection node), these particles collide and "tumble," and thus reflect light toward the observer. With this information about the way the particles behave in the fluid, we can decipher both what we see occurring in the videos, and the structure of the luminosity function.
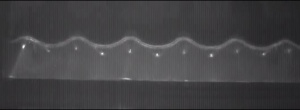
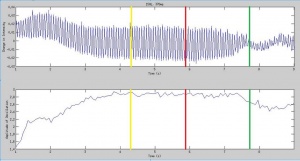
In each video, we see several qualitative stages in the onset of the Faraday waves, delineated by visible changes in structure. First, after the forcing function is applied, we quickly see the formation of "dots," as in the figure below, which we suspect are the centers of convection nodes. Next, the surface waves begin to form. Finally we see these distinct dots in the centers of the convection nodes "fall" and then fade out, as if the convection nodes are growing in size and slowing in rate. Soon after this point, the wave settles into its steady state oscillation.
These qualitative transition points are reflected distinctly in the luminosity function. In the first stage, before the convection nodes appear, the luminosity function begins to oscillate in time with the forcing function. After the convection nodes appear, the mean of this oscillation begins to fall, as the fluid flows in the 2D plane set in. Then the surface waves form, and the oscillation in the luminosity function damps out in favor of steady flows. As the internal flows move deeper into the fluid (away from just the surface), the convection "dots" fall and fade out. After this time, the luminosity function increases as the shears in the fluid flow increase. As the surface waves oscillate (troughs becoming peaks, and vice versa), the internal flows also oscillate, creating shear forces as they switch direction. These shear forces create tumbling particles which increase the total reflected luminosity from that of the previous stages (though still lower than the initial, still, fluid, where many particles still align with the in-plane flows). The luminosity function then settles into a steady oscillation in time with the surface oscillations. When we turn off the forcing around 18s, the fluid settles, and the reflected luminosity increases slightly, back up to the high baseline of the still fluid where the particles are randomly oriented.
As the amplitude of the forcing increases, the profile of the luminosity function changes, especially in the early stages of onset. At higher forcing amplitude, the amplitude of the oscillations in the luminosity function grow much larger than in the lower amplitude case. While this makes the graphs look quite different at first glance, the behavior of the mean and relative amplitude is the same.

Conclusion
These results give us a qualitative narrative of what the internal fluid flows are like at the onset of the Faraday instability. However, to do a more detailed analysis,the flows would have to be measured directly using Particle Image Velocimetry (or PIV). PIV uses the changing local densities of particles from frame to frame in the video to estimate the flow field. PIV techniques could be applied to videos similar to those produced by the current work. To do this, however, would require more precise control of lighting conditions, and specifically, greater uniformity of fluid illumination by the laser sheet. Future works may pursue this line of observation, and the subsequent theoretical explanations of what is observed.
