File:Phase-comparison.png: Difference between revisions
Jump to navigation
Jump to search
(The triangle represents the lead cricket, and the circle represents the follower. As can be seen, the follower in the P-S model will always achieve a maximum possible gain when overtaking the leader, whereas most values of the gain in the phase response m) |
(No difference)
|
Latest revision as of 17:00, 13 December 2012
The triangle represents the lead cricket, and the circle represents the follower. As can be seen, the follower in the P-S model will always achieve a maximum possible gain when overtaking the leader, whereas most values of the gain in the phase response model will be less than optimal.
File history
Click on a date/time to view the file as it appeared at that time.
| Date/Time | Thumbnail | Dimensions | User | Comment | |
|---|---|---|---|---|---|
| current | 17:00, 13 December 2012 | 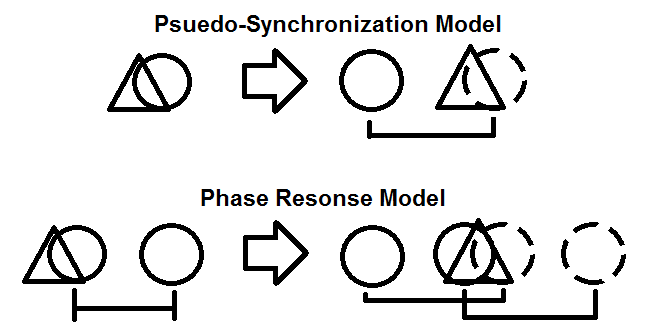 | 650 × 327 (12 KB) | Justin (talk | contribs) | The triangle represents the lead cricket, and the circle represents the follower. As can be seen, the follower in the P-S model will always achieve a maximum possible gain when overtaking the leader, whereas most values of the gain in the phase response m |
You cannot overwrite this file.
File usage
The following page uses this file: