Hopping dynamics: Difference between revisions
(→Videos) |
(→Videos) |
||
| Line 91: | Line 91: | ||
<videoflash type="vimeo">50067175</videoflash> | <videoflash type="vimeo">50067175</videoflash> | ||
<videoflash> | <videoflash type="vimeo">50067176</videoflash> | ||
Latest revision as of 13:35, 24 September 2012
Updated September 21, 2012. This project has led to a paper published in Physical Review Letters
Non-linear dynamics of hopping
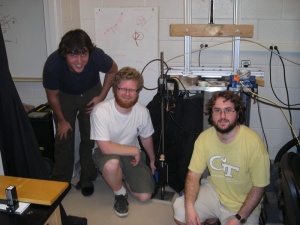
Group members: Reuven Ballaban, Stefan Froehlich, Julien Stalla-Bourdillon
Main presentation. Papers: Reuven, Stefan, Julien
This is the website for Team Hopping Robot. As a project for our Nonlinear Dynamics and Chaos class at Georgia Tech, we examined the behavior of a hopping robot and analyzed its behavior across a large parameter space. You can view our abstracts, papers, presentation, and video of the robot in action on this website.
Abstract
The behavior of a simple hopping robot, with its motion fixed in one dimension, was analyzed. A spring was affixed to the bottom of an actuator, and the motion of the actuator was made to be sinusoidal, with varying frequencies and amplitudes of oscillation. The motion of the robot was captured using 100fps video, and the resulting behavior analyzed using various accepted techniques. The jumping robot exhibited 1-cycle, 2-cycle, 3-cycle and chaotic motion, which was mostly consistent with available models of similar systems, with important differences. Mathematical techniques are used to determine how chaotic the system is, and the bistability of different n-cycles with the same starting parameters is examined in detail.
Methods
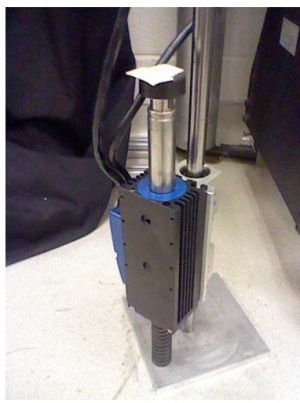
The jumping robot is comprised of a Copley Controls Linear Actuator applying a driving force to a “pogo stick”. The “pogo stick” consists of a short rod with a rigid spring attached to the end of it, and the robot is restricted to vertical motion by a guide pole. The actuator produced a sinusoidal motion on the pogo stick, giving the robot a sinusoidal forcing and causing it to hop. The amplitude and frequency of the sinusoidal motion were varied and the resulting dynamics of the system studied.
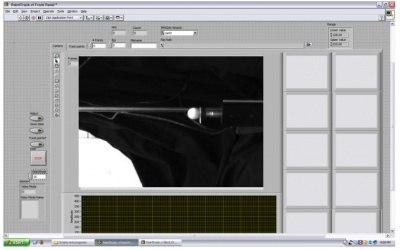
Originally the motion of the robot was to be recorded using a high bandwidth accelerometer, but difficulties with tangled wires and maintaining the apparatus for longer runs caused us to instead turn to a motion capture system. The video was taken at 100fps and tracked the motion in labview (see image below) of a small wooden ball placed on top of the pogo stick.
While the setup could produce excellent granularity for the amplitude, difficulty with the software caused the actuator to only be able to produce waves with integer frequencies. This led us to fix the frequency and then run a sweep through a range of amplitudes. We were limited on the range of amplitudes because if it was too low the robot would not make it off of the ground, and if it was too high then we ran the risk of the robot damaging itself and the surrounding equipment. We took these restraints into account and chose an appropriate range of amplitudes to run through. This sweep was done for each of the integer frequencies from 4Hz to 8Hz. The robot was allowed to run for 30-40 seconds in each run, unless it demonstrated interesting behavior that warranted more time. A MatLab script was then used to capture the peaks on each run which were then plotted on an orbit diagram for each frequency.
Data
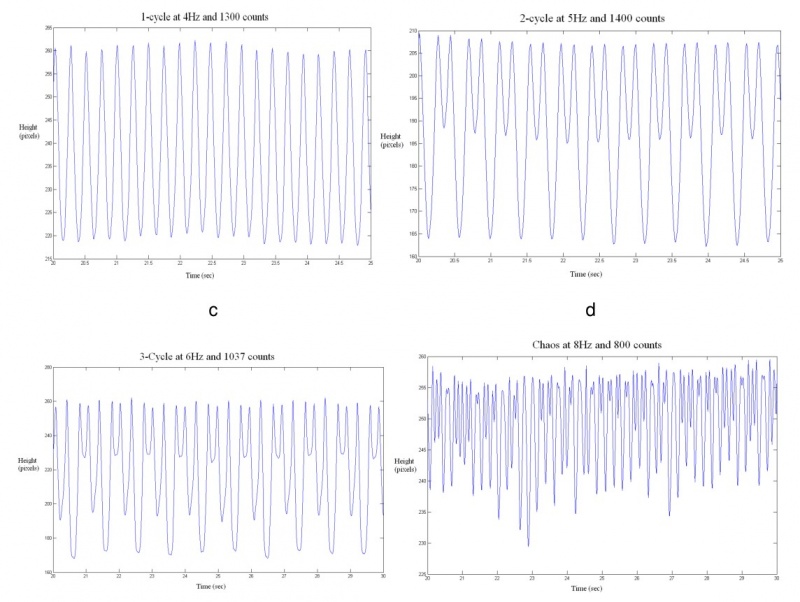
The robot demonstrated chaos along with 1-, 2-, and 3-cycles (Fig 1). While there were only stable 1-, 2-, and 3-cycles for the data we took, higher order cycles probably exist for the system. We were most likely unable to obtain them because of the many sources of noise in the system and the frailty of these cycles. The system usually experienced a transient behavior of 3- cycles before settling into its long term behavior. Therefore, by Sharkovsky's Theorem [5], the existence of these 3-cycles implies that our system must experience chaos.
The figure above shows examples of a 1-cycle, 2-cycle, 3-cycle, and chaos respectively. Due to the setup of the camera for the motion capture, the graphs are “inverted” from the actual motion of the robot. The top of the graphs are where the robot hits the ground and the bottom peaks are where the robot is actually airborne. The ground level seems to shift during these runs. This is caused by the robot rotating around the pole and the camera registering this horizontal motion as a slight change in height.
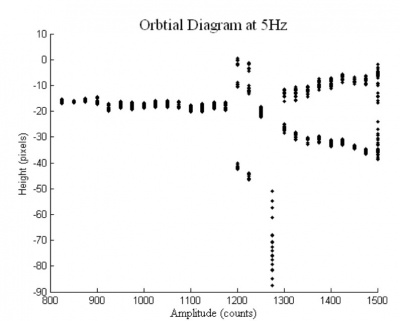
An orbit diagram was made for the data at each frequency. When making the diagrams, only the peaks of the last fourth of the run were plotted so that the transient behavior would not be included. The runs are done at increments of 25 counts for the amplitude, with the exception of 6Hz, where twice the resolution was done once the system demonstrated an interesting cascade.
For 5Hz, the runs began at 800 counts and ran up to 1500 counts. The 5Hz orbit diagram shown above a standard period doubling bifurcation from a 1-cycle to a 2-cycle. This bifurcation is different than in the usual cascade though because there are 3-cycles at 1200 counts and 1225 counts, near the end of the 1-cycle region, and a chaotic trajectory at 1275 counts, near the beginning of the 2-cycle region. The system never reached a region of purely chaos in the range of amplitudes taken. The system also experienced an interesting bi-stability where there were 3-cycles. The chaotic motion at 1275 counts in the 2-cycle region still demonstrated a local behavior similar to that of a 2-cycle.
Videos
These are videos of the robot in action. In both videos, the floor is to the right, and the ceiling to the left.
A run at an oscillation frequency of 5Hz, amplitude 1212cts:
<videoflash type="vimeo">50067175</videoflash>
<videoflash type="vimeo">50067176</videoflash>
